XRP holds $1.50 as ETF inflows and network activity cool
- XRP holds above the short-term $1.50 support, sustaining a solid bullish structure amid mild ETF inflows.
- The number of active addresses has halved to about 15,000 from a six-month high of 30,000 in September.
- XRP trades broadly sideways while firmly backed by major moving averages and the SuperTrend indicator’s dynamic support.

Ripple (XRP) is trading above $1.50 on Monday, as bulls struggle to sustain the recovery. Despite the sideways price action between support at $1.45 and supply at $1.60, XRP remains supported by uptrending major moving averages and key momentum indicators.
XRP uptake slows as on-chain activity fades
Appetite for crypto assets remains elevated with the Fear & Greed Index at 70 in the Greed territory on Monday, up from 65 the day before. Steady risk-on market sentiment suggests investors retain a solid bullish outlook despite the rallies in August and September.
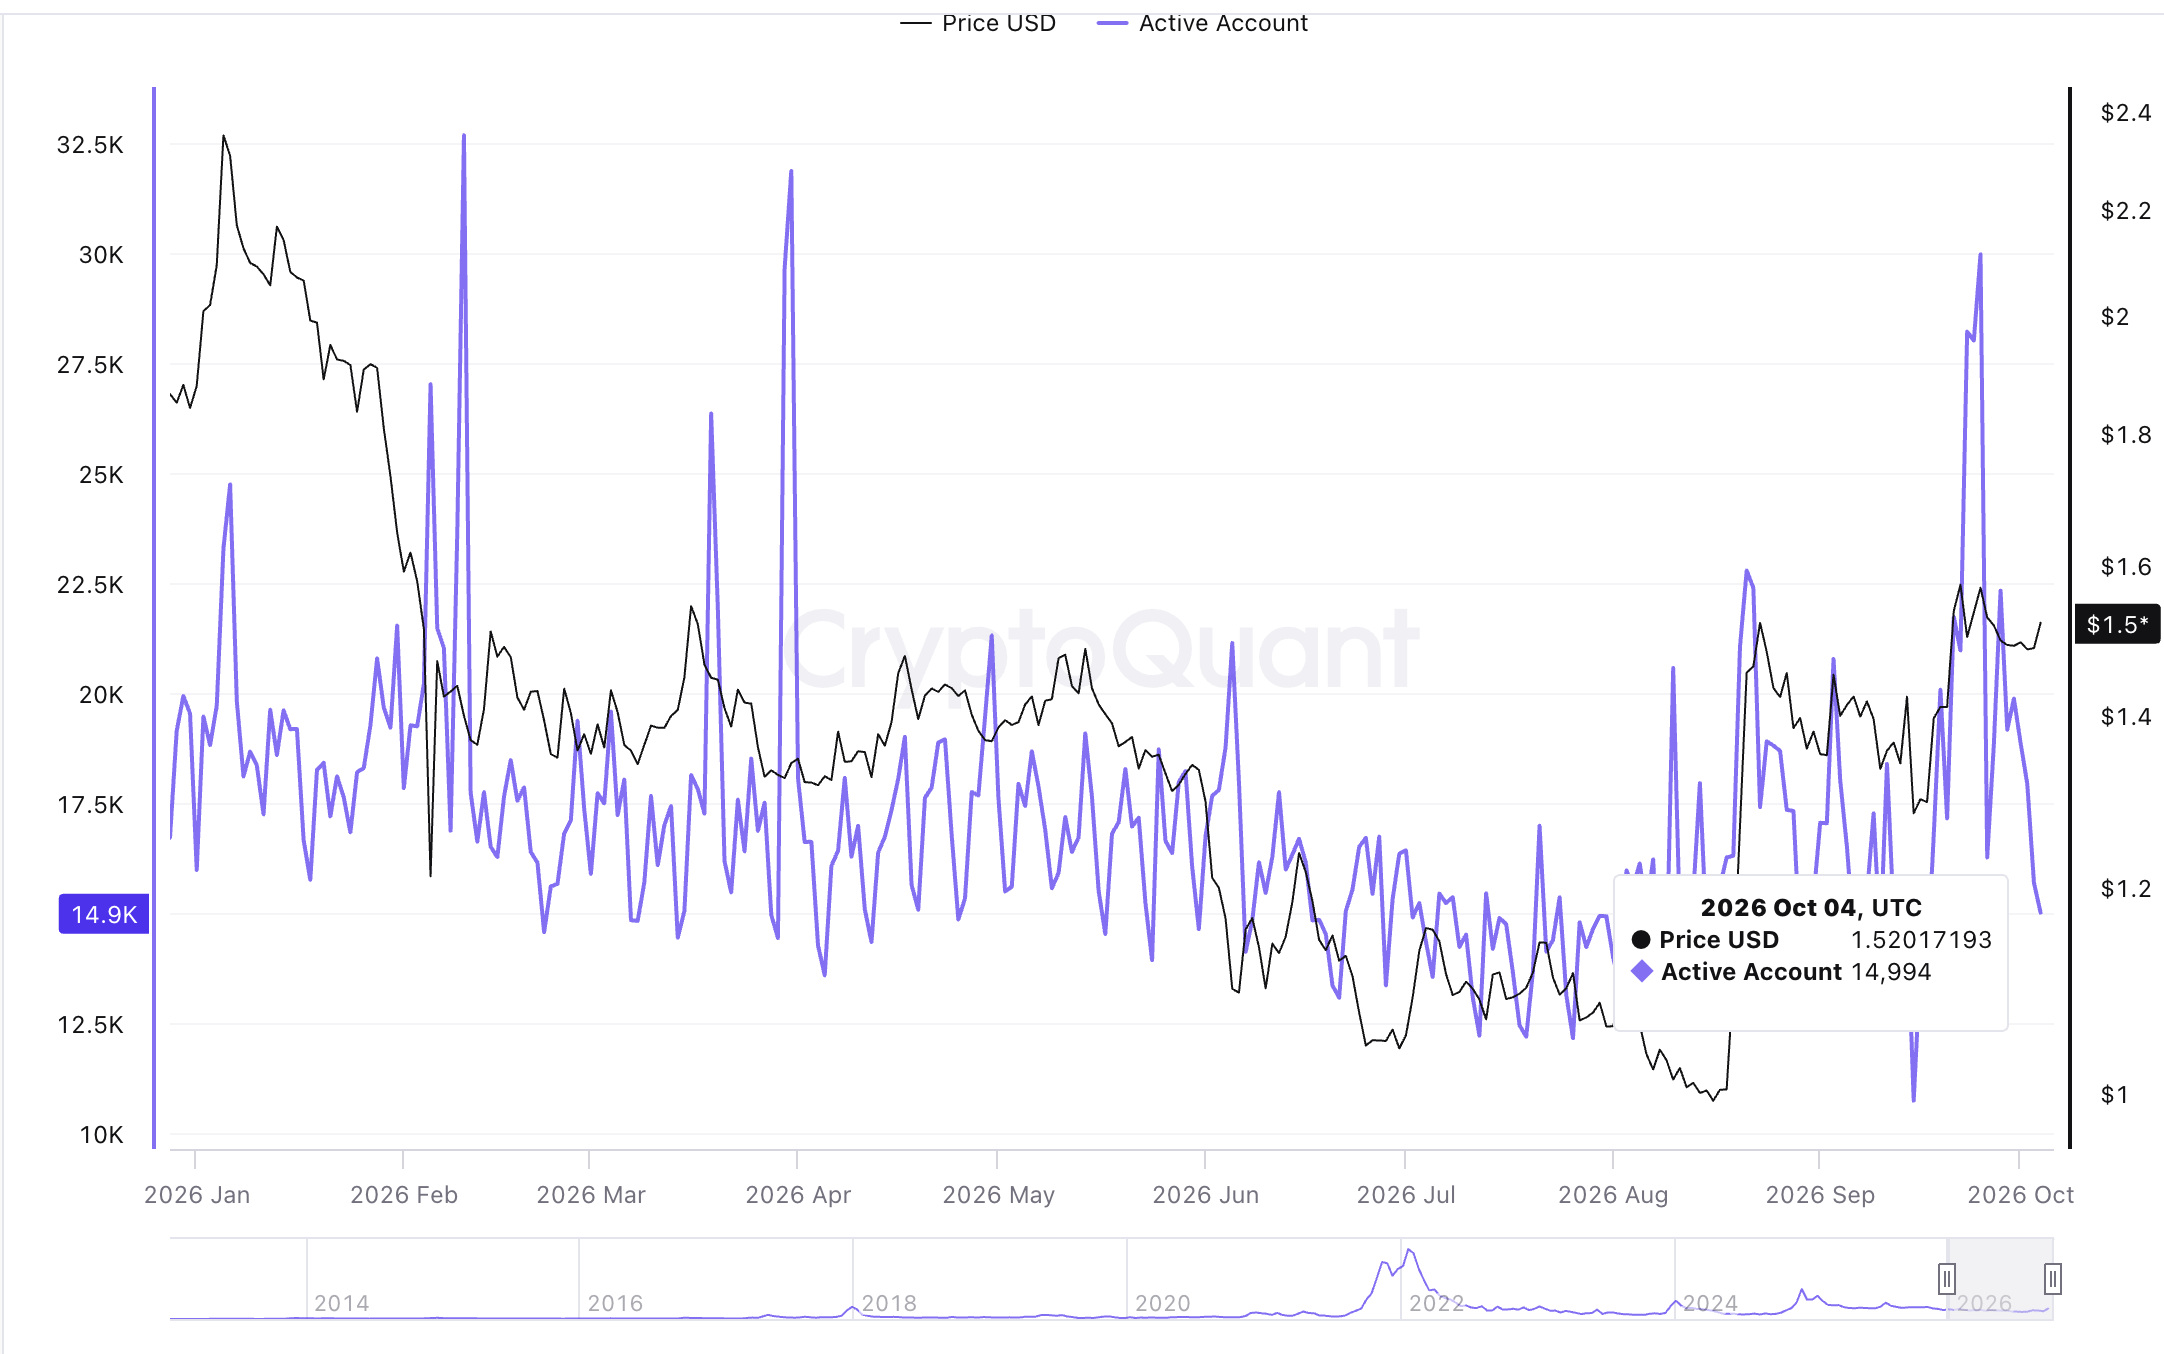
Still, the XRP Ledger (XRPL) continues to face declining user engagement, as reflected in the Active Addresses metric. The number of wallets actively interacting with the protocol by sending or receiving assets stands at roughly 15,000, down 50% from 30,000, the six-month peak reached on September 25.
CryptoQuant data shows the network has normalized following spikes in activity over the last few weeks. It currently holds near the lower end of the recent 90-day range. The latest reading also stands below the recent 30-day average in the17,000-18,000 range, suggesting fewer unique on-chain participants.
Notably, the cumulative XRP account count is rising, but daily active users are falling, showing that address creation and actual usage are diverging.
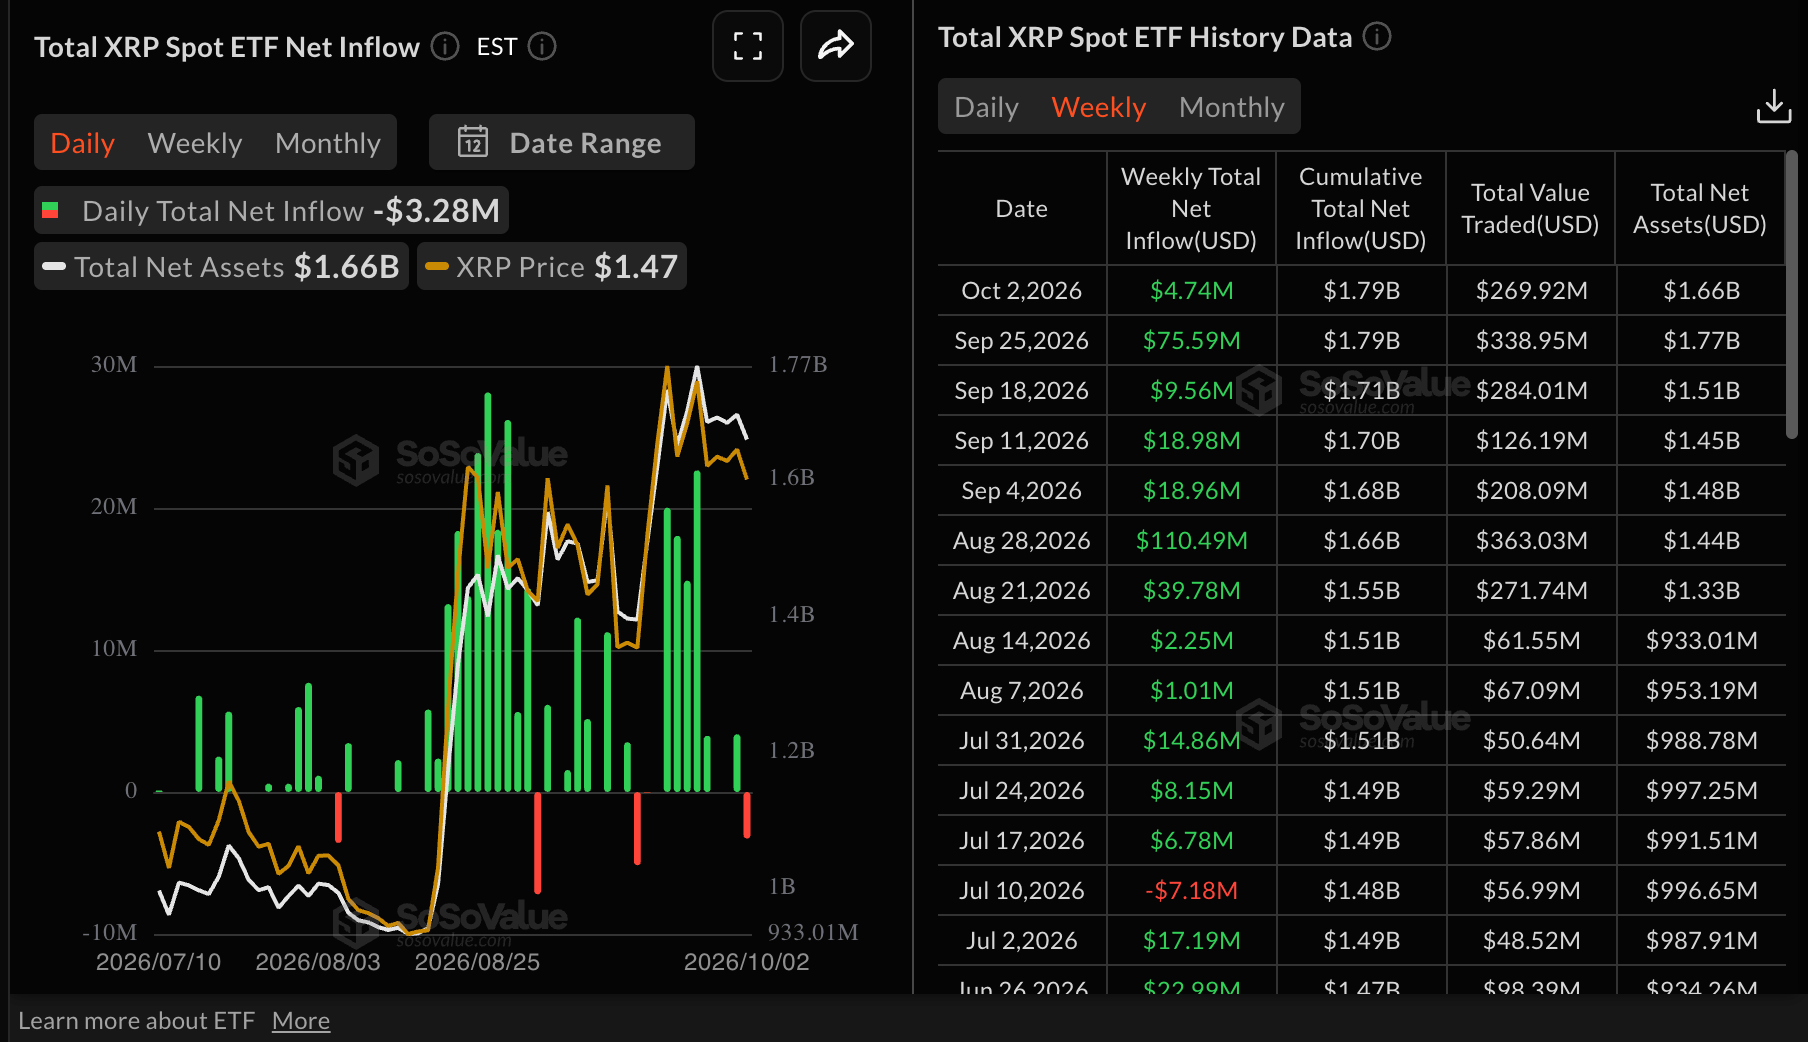
The blockchain’s reduced network activity, coupled with declining inflows into US-listed spot Exchange-Traded Funds (ETFs), reinforces the broader outlook of diminishing demand for XRP. XRP ETFs recorded nearly $5 million in inflows last week through Friday.
This represents the 12th consecutive week of positive ETF inflows, with cumulative inflows reaching $1.8 billion and total assets under management at $1.7 billion. However, this persistent capital inflow has yet to translate into a sustained long-term bullish trend for XRP.
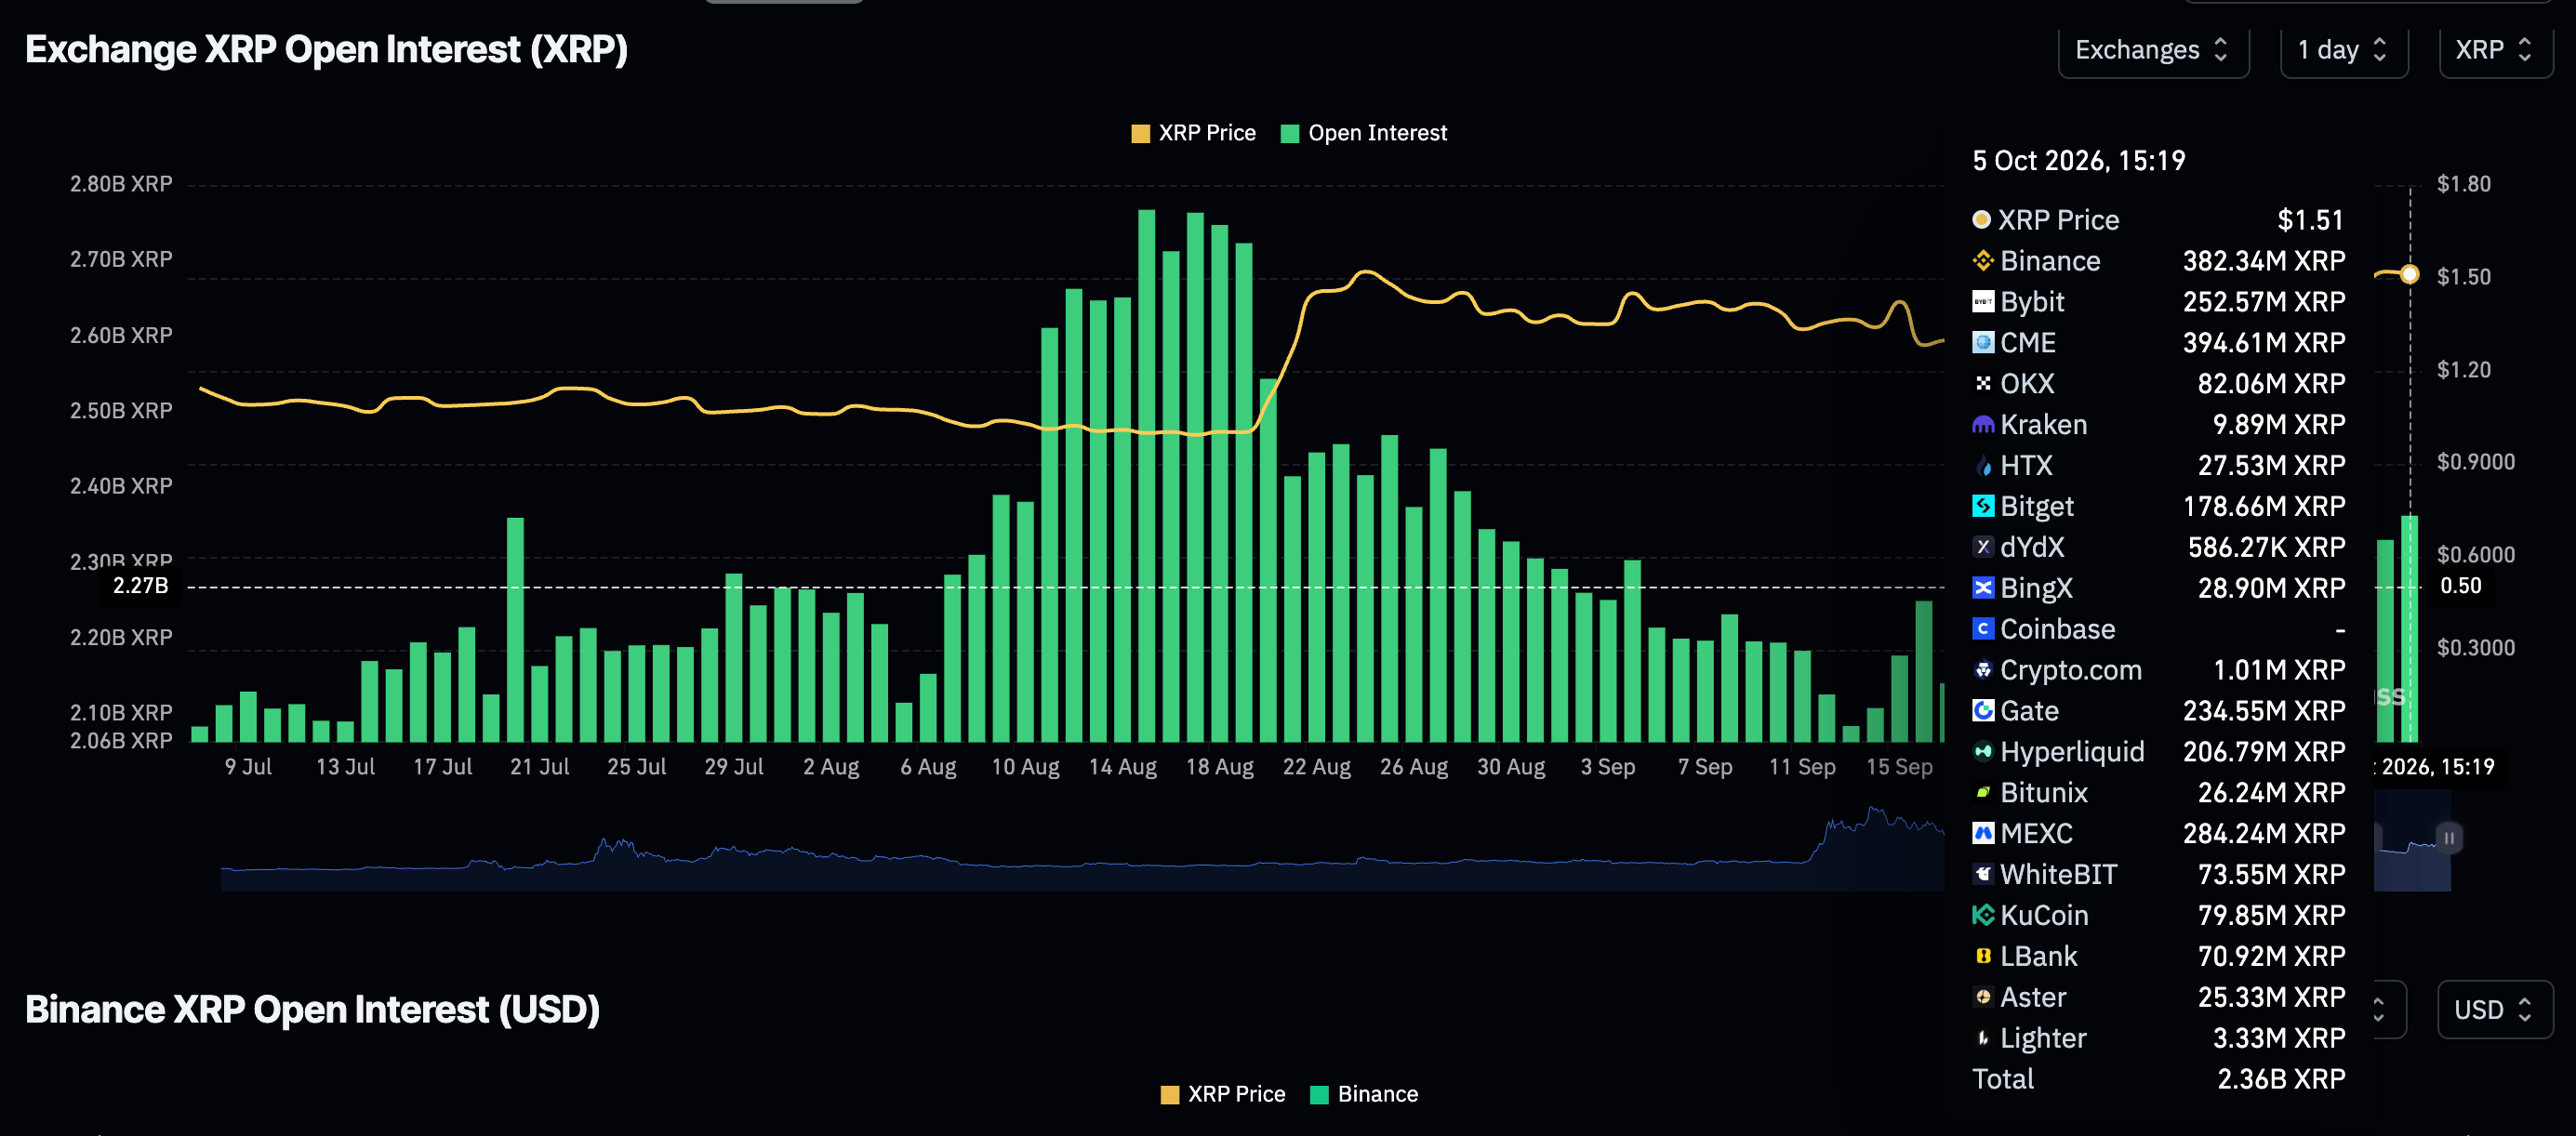
Meanwhile, XRP will likely continue to trade sideways between the lower range limit at $1.45 and the upper range limit at$1.60, given a steady derivatives market. The perpetual futures Open Interest (OI) holds at 2.26 billion XRP on Monday, up only marginally from 2.32 billion XRP the previous day. A sustained uptrend would provide the required tailwind to support an extended breakout above $1.60.
Technical Analysis: XRP holds higher support
XRP trades at $1.51 as headwinds trim accrued gains. Despite the minor pullback, the token holds a bullish near-term bias as price extends well above the 50-day Exponential Moving Average (EMA) at $1.40 and the 200-day EMA at $1.38, reinforcing a supportive trend backdrop.
The 100-day EMA at $1.33 and the SuperTrend line at $1.30 sit further below, outlining a layered demand zone beneath the market. Momentum is mixed, with the Relative Strength Index (RSI) at 58 suggesting constructive, but not overbought, conditions, while the Moving Average Convergence Divergence (MACD) indicator turns slightly negative below zero, hinting at waning upside pressure after the recent advance.
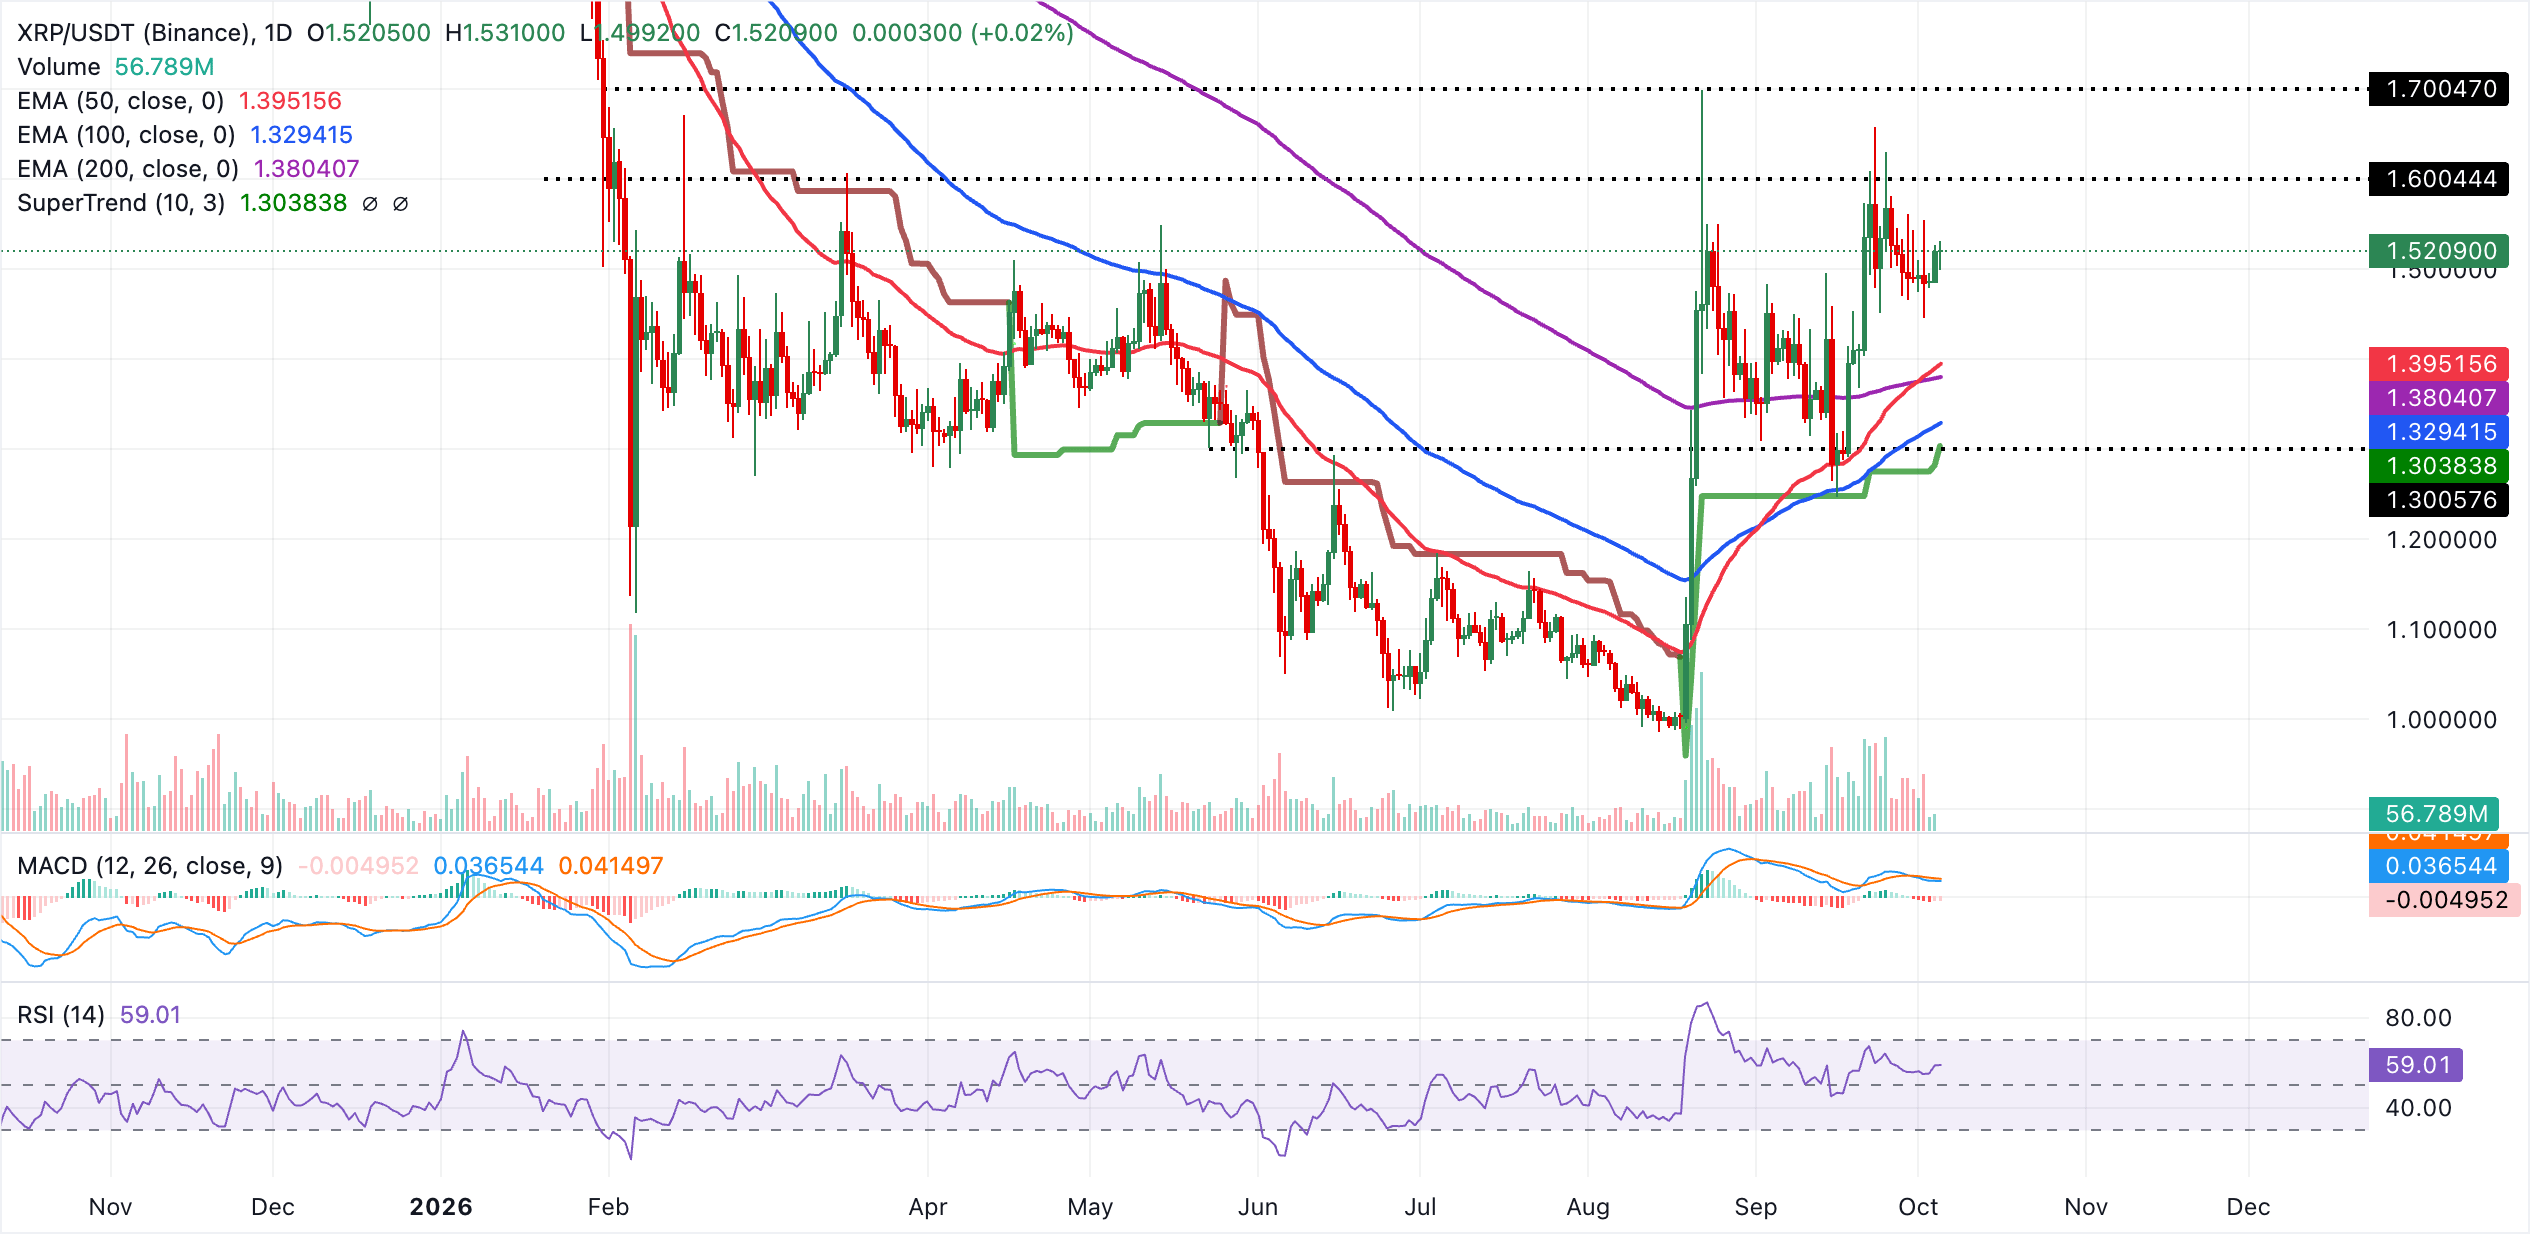
Immediate support lies at the 50-day EMA near $1.40, ahead of the 200-day EMA at $1.38, which should act as a secondary floor if a deeper pullback unfolds. Below these, the 100-day EMA at $1.33 and the SuperTrend level at $1.30 define a broader structural demand band that should underpin the larger bullish trend if tested.
With no clear overhead technical levels on the daily chart, bulls would retain control as long as XRP holds above the $1.40-$1.38 EMA cluster, while further weakness through that zone would signal a transition towards a more neutral tone.
(The technical analysis of this story was written with the help of an AI tool. Know more.)
Open Interest, funding rate FAQs
Higher Open Interest is associated with higher liquidity and new capital inflow to the market. This is considered the equivalent of increase in efficiency and the ongoing trend continues. When Open Interest decreases, it is considered a sign of liquidation in the market, investors are leaving and the overall demand for an asset is on a decline, fueling a bearish sentiment among investors.
Funding fees bridge the difference between spot prices and prices of futures contracts of an asset by increasing liquidation risks faced by traders. A consistently high and positive funding rate implies there is a bullish sentiment among market participants and there is an expectation of a price hike. A consistently negative funding rate for an asset implies a bearish sentiment, indicating that traders expect the cryptocurrency’s price to fall and a bearish trend reversal is likely to occur.
Author

John Isige
FXStreet
John Isige is a seasoned cryptocurrency journalist and markets analyst committed to delivering high-quality, actionable insights tailored to traders, investors, and crypto enthusiasts. He enjoys deep dives into emerging Web3 tren




