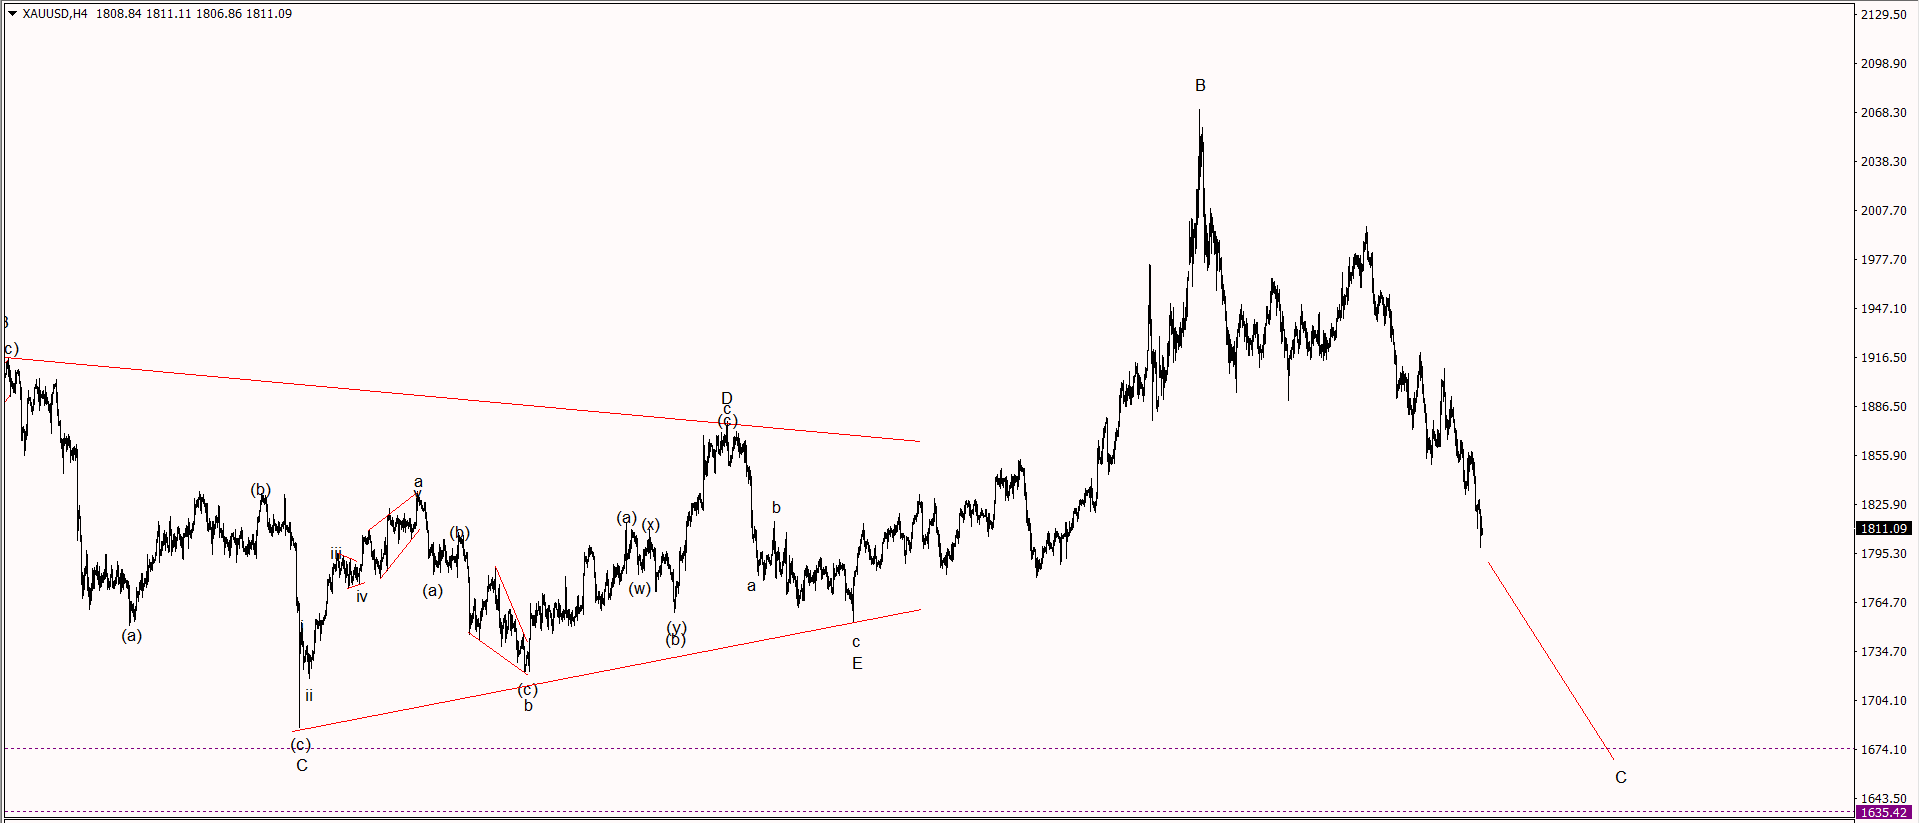
The chart below shows XAUUSD/GOLD. We see a triangle thurst higher. This sharp move higher confirmed the correction that we had seen for several months.
The move higher was overlapping and didn’t have the distinct, five-wave impulse we know. As expected the move higher did not reach new highs. The sharp move lower confirmed that we were dealing with a flat pattern. We have a clear five-wave move lower to mark wave 1 or A and a three-wave correction to mark.
We have a clear minimum target to the downside of 1800 as our first level and 1700 as our final target to complete the larger correction.
Key News, out this week: Tuesday 17th May Core Retail Sales m/m; Retail Sales m/m; Fed Chair Powell Speaks.
Res: 1855; 1900; 1945
Sup: 1800; 1750; 1700
None of the material published constitutes a trading recommendation of any particular security, portfolio of securities or investment strategy. This should not be taken as personal advice concerning nature, potential, value or suitability of any particular security, portfolio of securities, investment strategy or other matter. Past performance does not guarantee future results.
Recommended Content
Editors’ Picks
EUR/USD steady below 1.0800 after US PCE meets expectations
EUR/USD remains depressed below 1.0800 after soft French inflation data, amid minimal volatility and thin liquidity on Good Friday. The pair barely reacted to US PCE inflation data, with the Greenback shedding some pips. Fed Chair Jerome Powell set to speak ahead of the weekly close.
GBP/USD hovers around 1.2620 in dull trading
GBP/USD trades sideways above 1.2600 amid a widespread holiday restraining action across financial markets. Investors took a long weekend ahead of critical United States employment data next week. Fed Chair Powell coming up next.
Gold price sits at all-time highs above $2,230
Gold price holds near a fresh all-time high at $2,236 in thinned trading amid the Easter Holiday. Most major world markets remain closed, although the United States published core PCE inflation, the Federal Reserve’s favorite inflation gauge.
Jito price could hit $6 as JTO coils up inside this bullish pattern
Jito (JTO) price has been on an uptrend since forming a local bottom in early January. Since then, JTO has revisited the key swing point formed in early December, suggesting the bulls’ intention to move higher.
Key events in developed markets next week
Next week, the main focus will be inflation and the labour market in the Eurozone. We expect services inflation to be impacted by the easter effect, while the unemployment rate to be unchanged.