Wyckoff spring pattern suggests a temporary market bottom in S&P 500 [Video]
![Wyckoff spring pattern suggests a temporary market bottom in S&P 500 [Video]](https://editorial.fxstreet.com/images/Markets/Equities/SP500/wall_street_nyse3-637299021683820849.jpg)
Is this a low or the low in the stock market? What can we expect from the Wyckoff spring in S&P 500 while the war between Russia and Ukraine is on-going?
Click and watch the video below on YouTube (Pro Tip: adjust the speed to 1.5–2X):
There are more buy signals (295) than sell signals (79) as shown up in my stock screener despite the bearish market sentiment. Refer to the screenshot below:
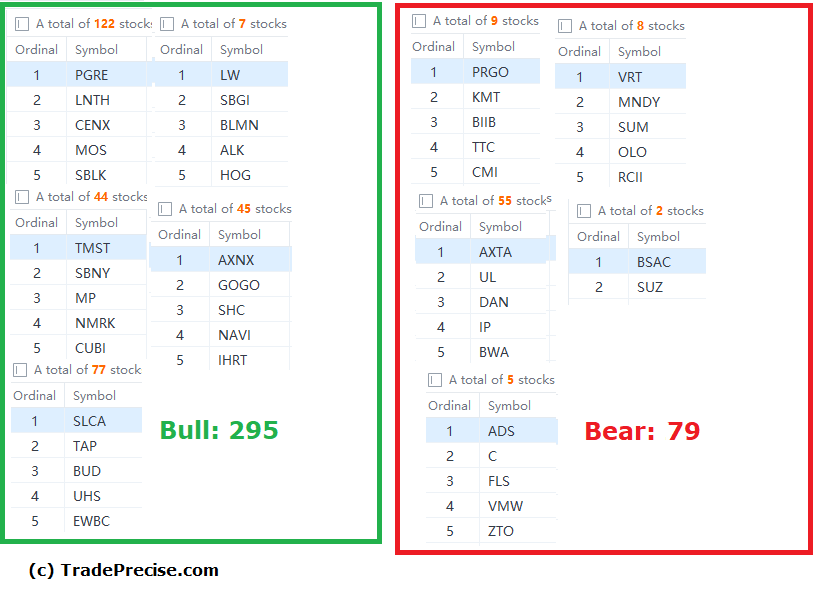
Risk management is extremely important to survive in this volatile market.
Author

Ming Jong Tey
Independent Analyst
Ming Jong Tey has been trading since 2008. He started his learning journey from technical analysis (indicators, Fibonacci, etc...) to value investing. Throughout his journey, he develops an interest in price action with chart pattern trading.
More from Ming Jong Tey


