WTI Crude Oil outlook: Has the market priced the Hormuz recovery too soon?

WTI has fallen sharply into the mid-$70s as traders price a greater chance of improving Gulf supply, but the physical market, refined-product inventories and futures curve suggest conditions are not yet anywhere near normal.
WTI crude oil has just given traders a useful reminder of how quickly geopolitical premium can disappear.
At the end of July, WTI was trading in the mid-$80s. By the morning of 6 August, spot crude was back around $74.25.
That is a sizeable repricing in less than a week.
The obvious explanation is that traders have become more optimistic about diplomatic progress and the possibility of improved shipping through the Strait of Hormuz. If more Gulf oil can reach the international market, some of the supply premium built into crude prices no longer needs to be there.
The difficulty is that the physical oil market has not improved nearly as quickly as the price has fallen.
That is what makes the current setup interesting.
The sell-off makes sense if the market believes Gulf supply is going to normalise. What is less clear is whether WTI has already priced too much of that improvement before the barrels have actually arrived.
The market is pricing a solution that has not fully happened yet
The strongest argument against becoming aggressively bearish on crude at current levels comes from the physical market.
Gulf crude oil and condensate exports averaged roughly 10.7 million barrels per day in July. That was broadly stable from June, but still around 40% below pre-war levels.
Iraq managed to increase exports, while shipments elsewhere in the Gulf remained constrained and tanker traffic through key regional shipping routes continued to run below normal levels.
That creates an important distinction.
OPEC producers may have spare capacity. OPEC+ may raise quotas. Saudi Arabia may be capable of increasing production.
None of that is the same thing as those barrels reliably reaching international buyers.
The bottleneck is not simply how much oil can be produced. It is whether that oil can be transported, refined and distributed.
There is also less readily available crude stored inside the Gulf than there was around the previous improvement in shipping conditions. That potentially limits how quickly additional barrels can return to the market even if transit conditions improve.
This is why I would be careful about treating every positive diplomatic headline as automatically bearish from here.
The first move lower was about expectations.
The next one probably needs barrels.
OPEC+ is adding supply, but the timing matters
There is a legitimate bearish supply argument building further out.
OPEC+ has agreed to increase production quotas by another 188,000 barrels per day from September, continuing the gradual restoration of previously withheld supply.
In a normal oil market, rising OPEC+ production combined with growing non-OPEC supply would be a fairly straightforward bearish development.
Today it is more complicated.
Previous quota increases have not translated cleanly into an equivalent increase in crude reaching the global market because transportation and geopolitical disruptions remain part of the equation.
That means additional OPEC+ production becomes much more important if the security situation improves.
Outside OPEC+, the longer-term supply picture is also becoming less supportive for oil prices.
US crude production remains close to record levels, while Brazil and Guyana continue to add meaningful production.
The US shale industry is not behaving exactly as it did during previous oil booms, though. Producers have generally remained more disciplined with capital expenditure and have been less willing to chase every short-term spike in crude prices with aggressive drilling.
That probably limits how quickly non-OPEC supply can solve today's shortage.
Over six to twelve months, however, rising production outside the Middle East becomes a much more meaningful bearish force.
Demand is the weakest part of the bullish argument
If supply is the strongest part of the near-term bull case, demand is easily the weakest.
There is still a sizeable disagreement between the major forecasting agencies.
The IEA expects global oil demand to contract by around 1 million barrels per day in 2026 before recovering in 2027.
The EIA is slightly more bearish and expects an even larger decline this year.
OPEC remains more optimistic and continues to forecast positive global demand growth, although it has reduced those expectations.
That difference matters.
If the IEA and EIA are broadly right, demand destruction has already done a considerable amount of the work required to balance the market.
If OPEC is closer to the mark, restoring Middle Eastern supply into a market where consumption is still expanding becomes much less bearish.
China sits right in the middle of that debate.
Chinese crude imports weakened sharply in June and refinery activity also fell.
Some of that reflects genuinely softer demand. But some also reflects the difficulty and cost of sourcing Middle Eastern crude during a period of disrupted supply.
China has responded by increasing purchases from alternative suppliers, including Russia.
So I would not interpret every missing barrel of Chinese imports as permanent demand destruction.
Some of it is clearly a sourcing problem.
Even so, the broader demand picture remains the strongest reason not to assume that tight physical conditions automatically take WTI back towards $100.
US inventories are telling two different stories
The latest US inventory figures initially looked bearish.
Commercial crude inventories increased by around 2.5 million barrels, while stocks at Cushing also rose.
The market had expected crude inventories to decline.
But the headline does not tell the whole story.
Commercial crude inventories remain below their five-year seasonal average.
Gasoline stocks are also below normal seasonal levels.
Distillate inventories are tighter still.
At the same time, US refineries are already operating at very high utilisation rates.
That matters because the world does not consume crude oil directly.
Crude has to reach a refinery and then be converted into diesel, gasoline, jet fuel and other products.
So it is entirely possible for crude availability to improve while refined-product markets remain tight.
That appears to be part of what is happening now.
The crude market is loosening faster than the product market.
A single weekly crude build therefore does not tell us that the wider supply problem has disappeared.
What would matter far more would be several weeks of broad-based inventory rebuilding across crude and refined products.
The futures curve is still warning against complacency
One of the more useful signals is coming from the futures curve.
Brent has moved back into backwardation.
Put simply, the market is willing to pay more for oil available now than for oil delivered further into the future.
That normally tells us that prompt barrels remain valuable, inventories are relatively scarce and there is little incentive to buy crude simply to store it.
That does not sit particularly comfortably with the idea that the physical market is already oversupplied.
There is no contradiction in oil prices falling while the curve remains tight.
Futures prices can start discounting an improvement before that improvement appears in actual physical flows.
But it does mean there is a difference between where traders expect supply to be and where supply actually is today.
For me, that is one of the most important features of the current oil market.
Macro is a headwind, but it is not driving everything
The macro backdrop is not especially supportive for crude.
US interest rates remain relatively high, monetary policy is still restrictive and concerns about global growth have not disappeared.
That creates a natural headwind for commodity demand.
What is interesting is that the US Dollar has not been particularly strong during the latest fall in oil.
That tells us something.
If crude is falling sharply without a corresponding surge in the Dollar, this is unlikely to be mainly a currency-driven move.
It points back towards changing expectations around Middle Eastern supply.
Equity markets have also remained relatively resilient.
This does not look like a classic cross-asset recession trade where oil, equities, copper and credit all fall together.
The move in crude has been much more specific.
Positioning could amplify the next move
The most recent confirmed positioning data showed managed-money traders still carrying a meaningful net-long position before the latest sharp decline in oil.
That means some of the move lower was likely accompanied by long liquidation.
The next positioning data should give a better indication of how much speculative exposure has now been removed.
This is important because the setup is becoming increasingly two-sided.
If a large part of the geopolitical premium has already been stripped out and speculative longs have already been forced out, disappointing diplomatic news could generate a much sharper rebound than it would have done a week ago.
On the other hand, a genuine improvement in Gulf shipping accompanied by measurable increases in export volumes could validate the sell-off and trigger another leg lower.
The sentiment question is therefore fairly simple:
How much diplomatic success is already priced into WTI around the mid-$70s?
The charts are bearish, but WTI is approaching the area that matters
The technical picture is clearer than the fundamental one.
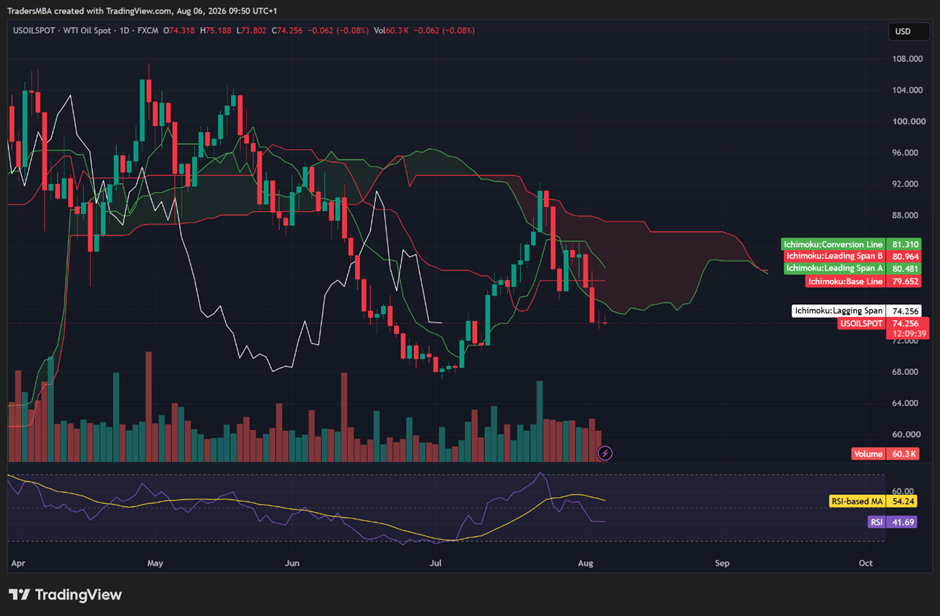
On the daily chart, WTI spot is trading around $74.25 and remains below the entire Ichimoku structure.
The Conversion Line is around $81.31, the Base Line around $79.65 and the projected cloud sits roughly around $80.50-$81.00.
Price structure has turned down following the late-July recovery, with lower highs and lower lows developing.
Daily RSI is around 42.
That confirms weak momentum, but it is not yet showing an extremely oversold market.
The first support area is around $73-$74.
Below there, $71-$72 becomes relevant, followed by the far more important $68-$70 region.
On the upside, a rebound towards $76 or $78 would not be enough to change the trend.
The first meaningful technical test comes around $79.50-$81.50, where several daily Ichimoku levels are concentrated.
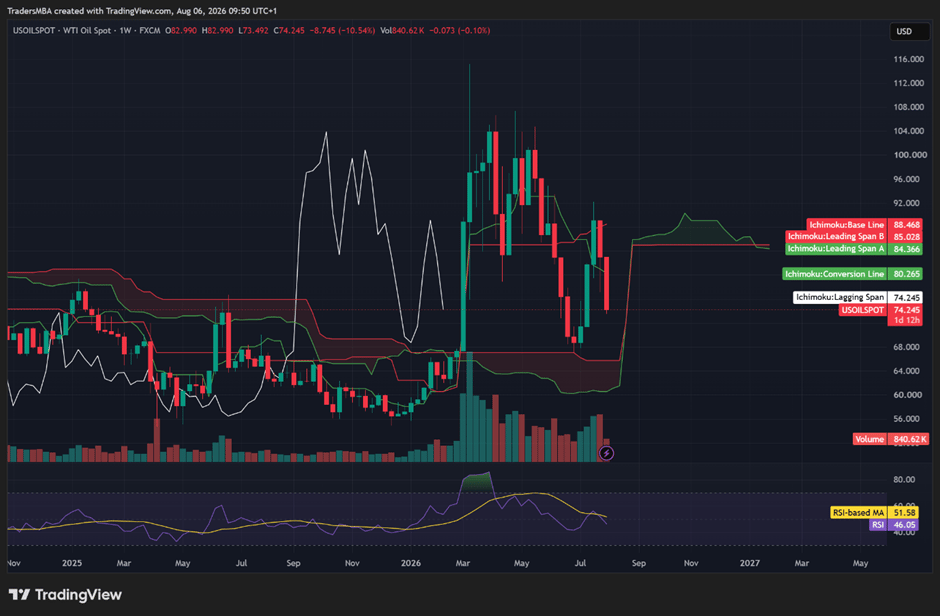
The weekly chart tells a similar story.
WTI is below the weekly Conversion Line near $80.27, below the projected cloud around $84-$85 and well below the Base Line near $88.50.
Weekly RSI is around 46, so momentum is bearish but not oversold.
The current weekly candle is still incomplete, which is important. The size of the current week's decline should not be treated as a confirmed weekly closing signal until the candle actually closes.
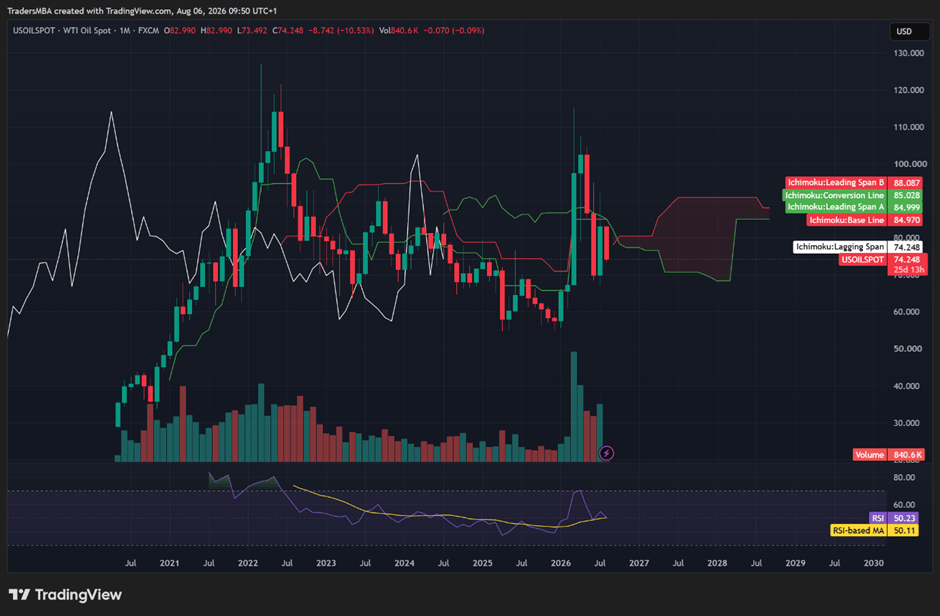
The monthly chart gives a bit more perspective.
Price is below the longer-term Ichimoku equilibrium area around $85-$88, but monthly RSI is almost exactly 50.
That suggests long-term momentum is neutral rather than decisively bearish.
This is why I see $68-$70 as the major structural line in the sand.
A convincing break below that area would turn the current decline from a sharp correction into a much more serious medium-term deterioration. It would bring approximately $64-$65 into play and potentially open the door towards the low $60s.
On the other side, oil would need to recover through $80-$81 and then establish itself above roughly $84-$85 before I would start treating the move as more than a relief rally.
A sustained recovery above approximately $85-$88 would materially improve the broader technical structure.
For now, the message from the charts is straightforward:
WTI is bearish, but it is moving towards support rather than breaking away from it.
Three ways this could play out
Base case — 55% probability: $72-$82.
My base case is that WTI begins to stabilise somewhere in the low-to-mid $70s rather than moving directly into the $60s.
Diplomatic negotiations can continue and Gulf traffic can improve gradually without producing immediate full normalisation.
Under that scenario, continued physical tightness and low product inventories should eventually make it harder for sellers to maintain the same pace of decline.
If $73-$74 holds, a recovery towards $78-$80 and potentially $82 becomes plausible.
This is not a longer-term bullish call on crude.
It is simply a view that price may have moved faster than the physical adjustment.
Bullish scenario — 25% probability: $85-$100+.
The upside scenario remains heavily dependent on geopolitics.
A breakdown in negotiations, renewed restrictions around Hormuz, further attacks on tankers or energy infrastructure, or additional regional disruption could put geopolitical premium back into crude very quickly.
A recovery through $82-$85 would strengthen this scenario technically.
A break back through the upper-$80s would suggest the market is starting to price a much more serious supply shock again.
Given how much premium has already been removed, renewed escalation could produce a sharp rather than gradual repricing.
Bearish scenario — 20% probability: $65-$70.
For this scenario to become the dominant one, I would want to see more than positive diplomatic headlines.
I would want to see Gulf exports rising consistently, tanker traffic recovering, inventories rebuilding and product-market tightness easing.
Combine that with additional OPEC+ production, strong US and Latin American supply and continued weakness in demand, and the medium-term picture becomes considerably more bearish.
Technically, a break below $73 would be the first warning.
A sustained loss of $68-$70 would be much stronger confirmation.
Where that leaves the overall outlook
My fundamental bias remains moderately bullish in the near term at around +12 on a -50 to +50 scale, mainly because the physical market still looks tighter than the headline price suggests.
Sentiment is moderately bearish at around -8, as traders increasingly price successful diplomacy and additional Gulf supply.
The technical picture is the weakest component at around -22, with the daily and weekly structures both remaining bearish.
Taken together, the simple average of those three readings is -6.
That leaves the overall picture slightly bearish to neutral.
I think that is a fair reflection of where crude stands today.
The physical market is providing support, but that is currently being outweighed by bearish price structure and a market that increasingly expects supply conditions to improve.
The reason I would not take the overall score significantly lower is that the market has already moved a long way in anticipation of that improvement.
The next stage has to be confirmed by the physical data.
What matters from here
The next EIA Short-Term Energy Outlook, IEA Oil Market Report and OPEC market report should give traders a clearer view of whether the current supply and demand assumptions remain realistic.
Weekly US inventory data are equally important.
Another crude build accompanied by further declines in gasoline or distillate stocks would reinforce the existing divergence between the crude and product markets.
Broad-based inventory rebuilding would be much more bearish because it would suggest genuine easing across the entire petroleum complex.
But some of the most important information will not come from the economic calendar.
Watch tanker movements through Hormuz.
Watch actual Gulf export volumes.
Watch the Brent futures curve.
Watch Cushing inventories.
Watch distillates.
Those indicators will tell us whether the physical market is actually following the story already being priced by WTI.
The decline into the mid-$70s is understandable.
The probability of improving supply has increased, global demand remains uncertain and more production capacity is available if shipping conditions normalise.
But the physical market has not normalised yet.
That leaves crude in an unusual position.
The technical trend is bearish, while the underlying physical supply picture remains considerably tighter than the price action alone would suggest.
From here, another sustained leg lower probably requires actual barrels rather than another headline.
If Gulf exports rise, tanker traffic normalises, inventories rebuild and refined-product tightness eases, the case for $65-$70 becomes much stronger.
If those things do not happen, pushing WTI significantly lower from the low-to-mid $70s may prove considerably more difficult than the last $10 decline.
The market has already priced part of the solution.
Now the physical oil market needs to deliver it.
Author

Sachin Kotecha
International Trading Institute (ITI)
Sachin Kotecha is a multi-asset trader, Professor at the International Trading Institute, and creator of institutional trading frameworks, macroeconomic intelligence platforms, and professional trading education programmes.














