Whether It Breaks Or Reverts To This Year’s Trend, 0.8500 Is Key For NZD/CAD

Just as NZD/CAD tests a key level of resistance, it’s worth considering its potential for a change of trend. Personally, I think the bearish trend on NZD/CAD has been one of the better ones for FX traders this year. Since failing to break a key resistance level in March, the commodity FX cross tumbled over 11% (or over 1000 pips) within a relatively clean downtrend.

Yet having tested the upper bounds of it bearish channel on the daily chart, NZD/CAD has approached an inflection point and there are compelling arguments for both bulls and bears to consider.
Bearish swing traders could take comfort in the following:
-
Price action remains within the bearish channel projected from the March peak, and the 100-day eMA is also capping as resistance.
-
Timing wise, yesterday’s high is eerily similar distance from its prior leak; the first spanned 85 days and yesterday’s spanned 82 days.
-
Whilst prices have recovered nearly 3% from this year’s low, the overlapping nature if price swings suggest the rebound is corrective, so poised to turn lower once more.
-
BoC have rates at a ‘whopping’ 1.75% compared with RBNZ’s 1.0%, which provides Canada a positive yield differential with New Zealand.
Contrarians (bulls in this instance) could take note of the following:
-
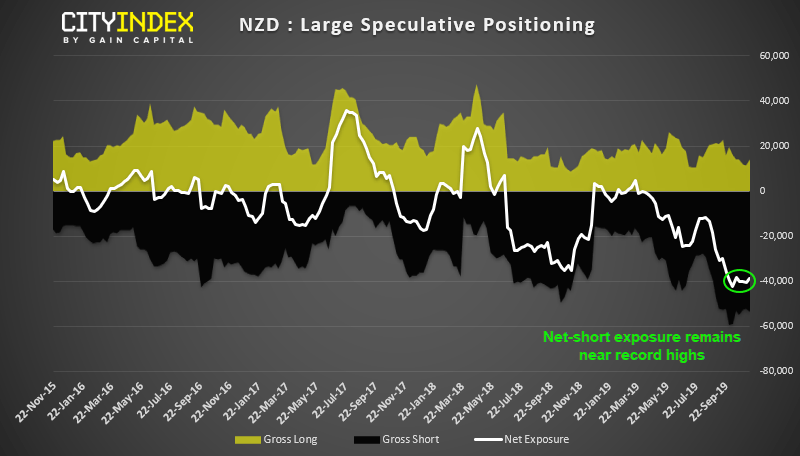
Net-short exposure on NZD futures remains near a historical extreme.
The 3-year Z-score is around -3.5 standard deviations and the 1-year was recently below -2 SD, level which have been associated with a short squeeze historically. Ultimately, NZD could be vulnerable to short covering (as seen yesterday) if data improves and / or RBNZ are less dovish. -
Whilst differentials currently favour CAD, markets will respond if they suspect this differential will narrow which would be positive for NZD/CAD.
And as it’s possible RBNZ will hold at 1% so, if CAD data weakens, then it could well send NZD/CAD higher. -
The CA2-NZ2 year differential is on the cusp of braking its bearish trendline.
-
Yes, prices have stalled near a cluster of resistance. Yet if these levels are to be broken it could trigger stops and exacerbate a bullish follow through.
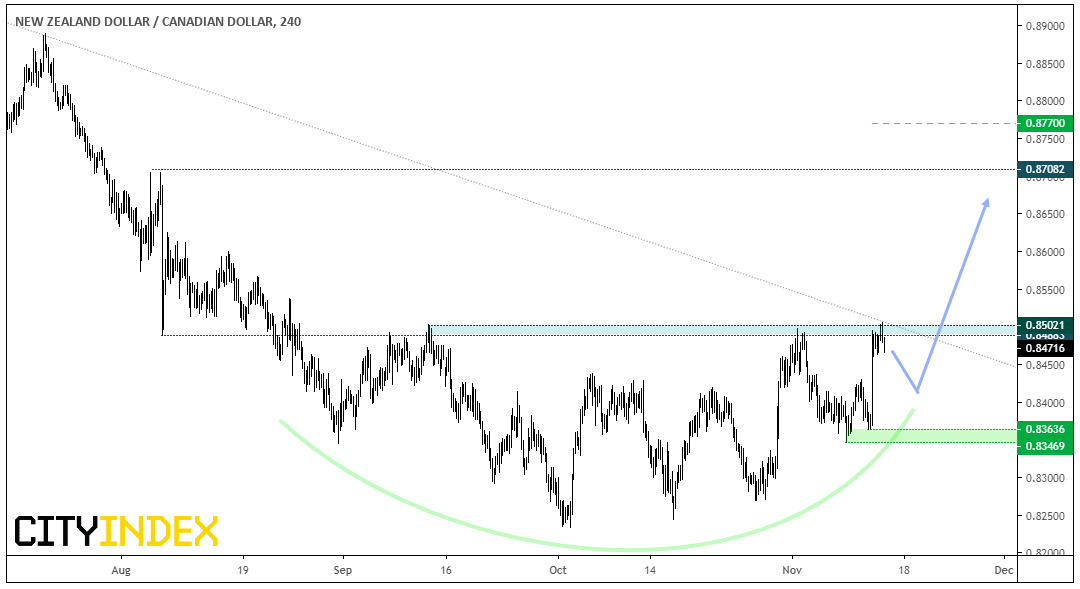
Given the importance of 0.8500 resistance, NZD/CAD could well turn lower over the near-term. Yet due to the strength of momentum leading into resistance, an eventual upside break is the bias whilst prices hold above the 0.8347/63 lows. Also take note of the rounding bottom forming which, if successful, projects an approximate target around 0.8770.
-
Bears could look to fade into moves below the trendline and / or 0.8500 resistance.
-
Bulls could wait for a break above 0.8500 to confirm the rounding bottom and target the 0.8700 highs (although target projects 0.8770).
-
Alternatively, for those who like to scale in, bulls could look for dips above the 0.83470/36 lows in anticipation of a breakout.
Author

Matt Simpson, CFTe, MSTA
CityIndex
Matt Simpson is a certified technical analyst who combines charts and fundamentals to generate trading themes.


