Weekly waves: EUR/USD, GBP/USD and Bitcoin
-
The EUR/USD bullish breakout is occurring after price action has made a higher low, which is probably a bullish WXY within a wave 4 and a larger downtrend.
-
A bullish breakout above resistance (red box) could see a push up towards the 38.2% Fibonacci level.
-
Bitcoin (BTC/USD) has not made a lower low for at least 4 weeks, which is increasing the chance that the wave A (gray) correction is completed.

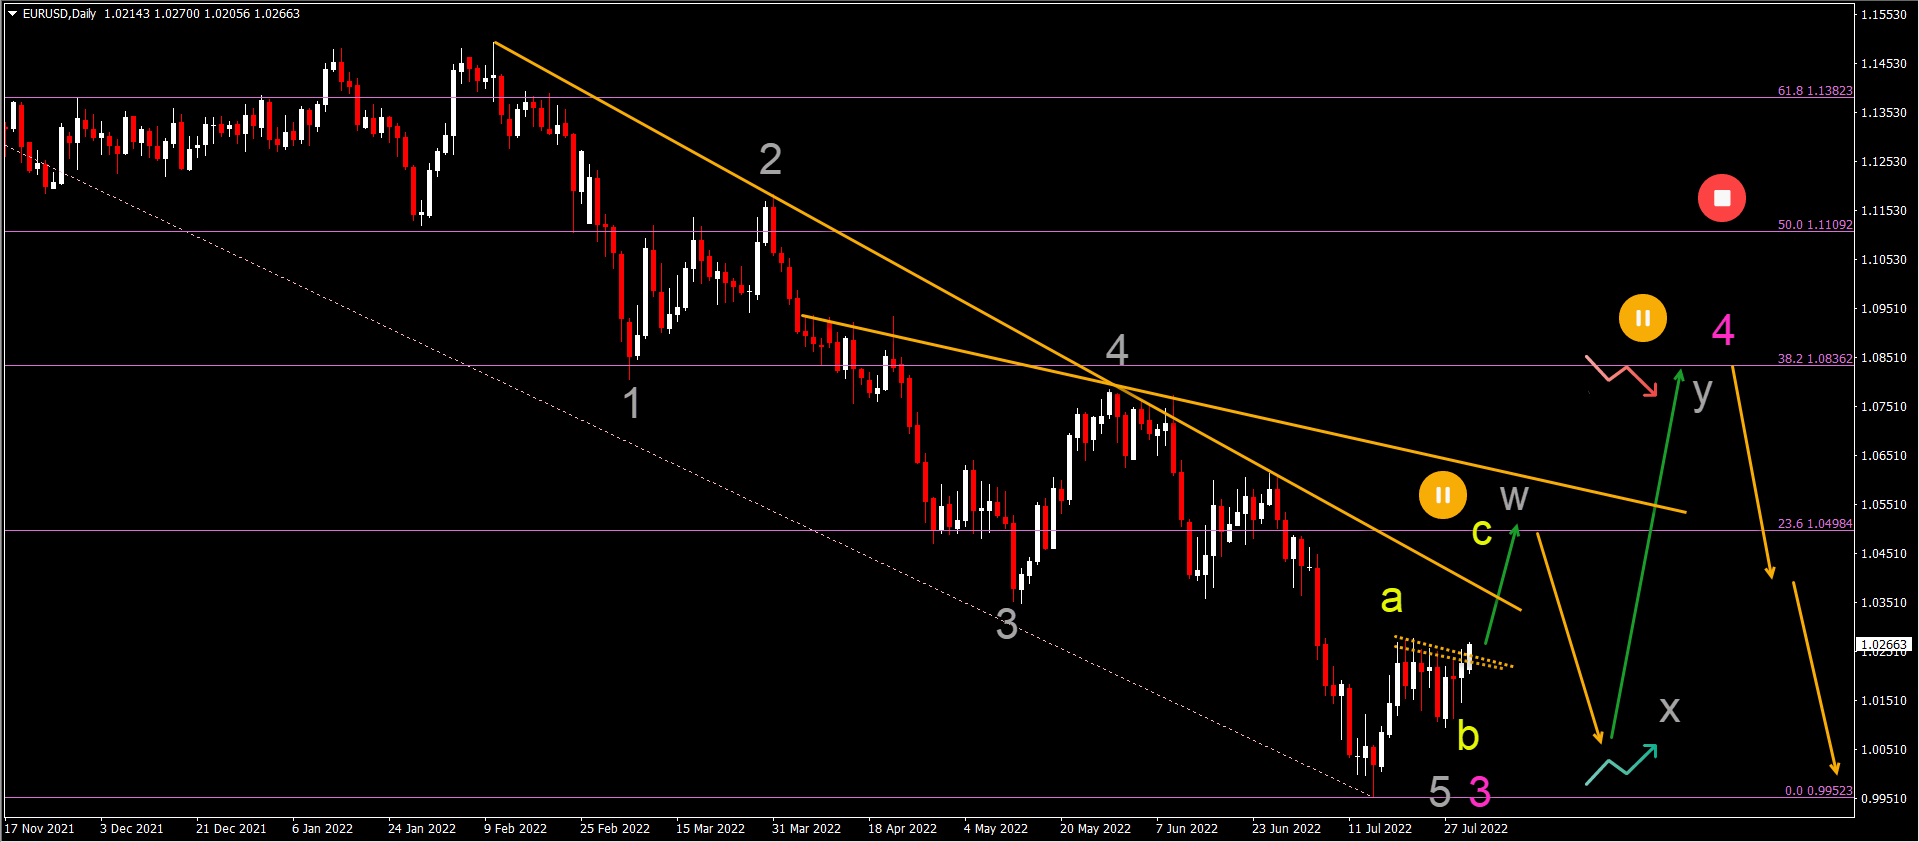
EUR/USD bullish correction aims at 1.05
The EUR/USD is breaking above the previous daily highs. Let’s review that to expect next:
-
The EUR/USD bullish breakout is occurring after price action has made a higher low.
-
The larger bearish 3 wave pattern is probably an ABC (yellow) zigzag of a larger WXY correction (gray).
-
The WXY (gray) should fit within a complex wave 4 pattern (pink).
-
The wave 4 (pink) is the main Elliott Wave analysis as long as price action respects the Fibonacci resistance levels and ideally stays below the 38.2% Fibonacci level.
-
Waves 4 are usually complex, lengthy and shallow corrections so a strong bearish bounce at the 38.2% Fibonacci level after a long correction is expected.
-
A break above the 50% Fibonacci level indicates an uptrend rather than a downtrend.
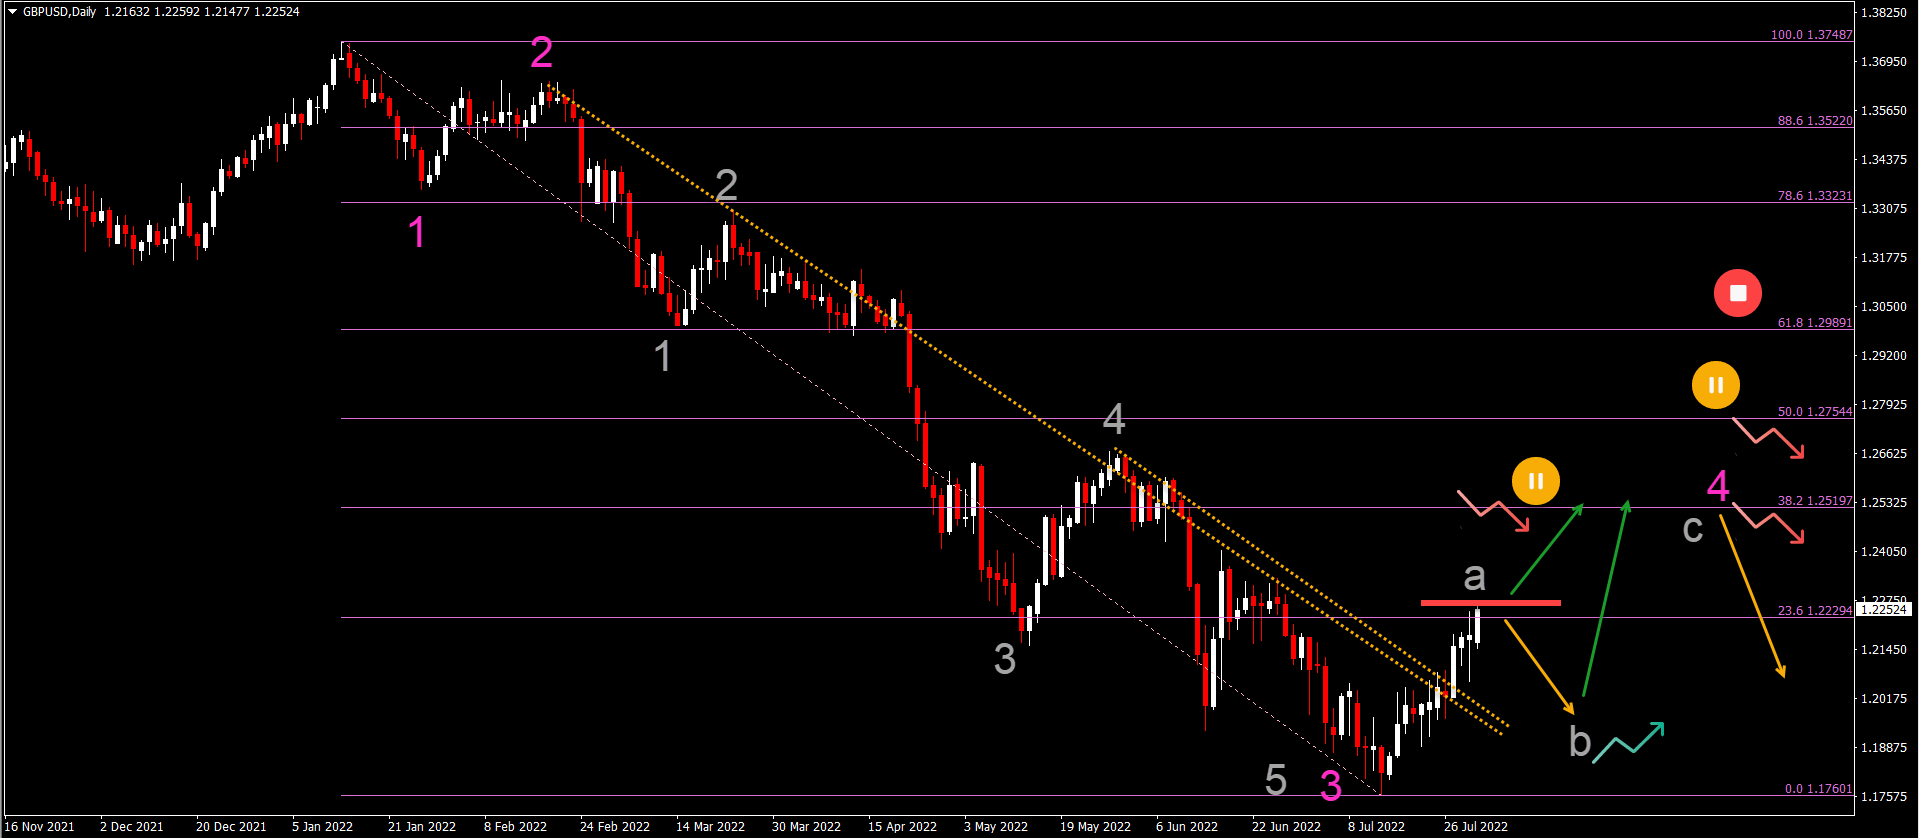
GBP/USD bullish swing aims at 38.2% Fib at 1.25
The GBP/USD has also made a bullish breakout above the resistance trend lines (dotted orange):
-
The GBP/USD seems to be in the same spot and situation as the EUR/USD.
-
We are expecting an ABC (gray) pattern or WXY correction within a wave 4 (pink).
-
The wave 4 remains valid as long as price action respects the shallow Fibonacci levels.
-
A bullish breakout above resistance (red box) could see a push up towards the 38.2% Fibonacci level.
-
A bearish bounce at the 38.2% Fibonacci level is then the most expected scenario.
-
A downtrend continuation could aim for a lower low around 1.15.
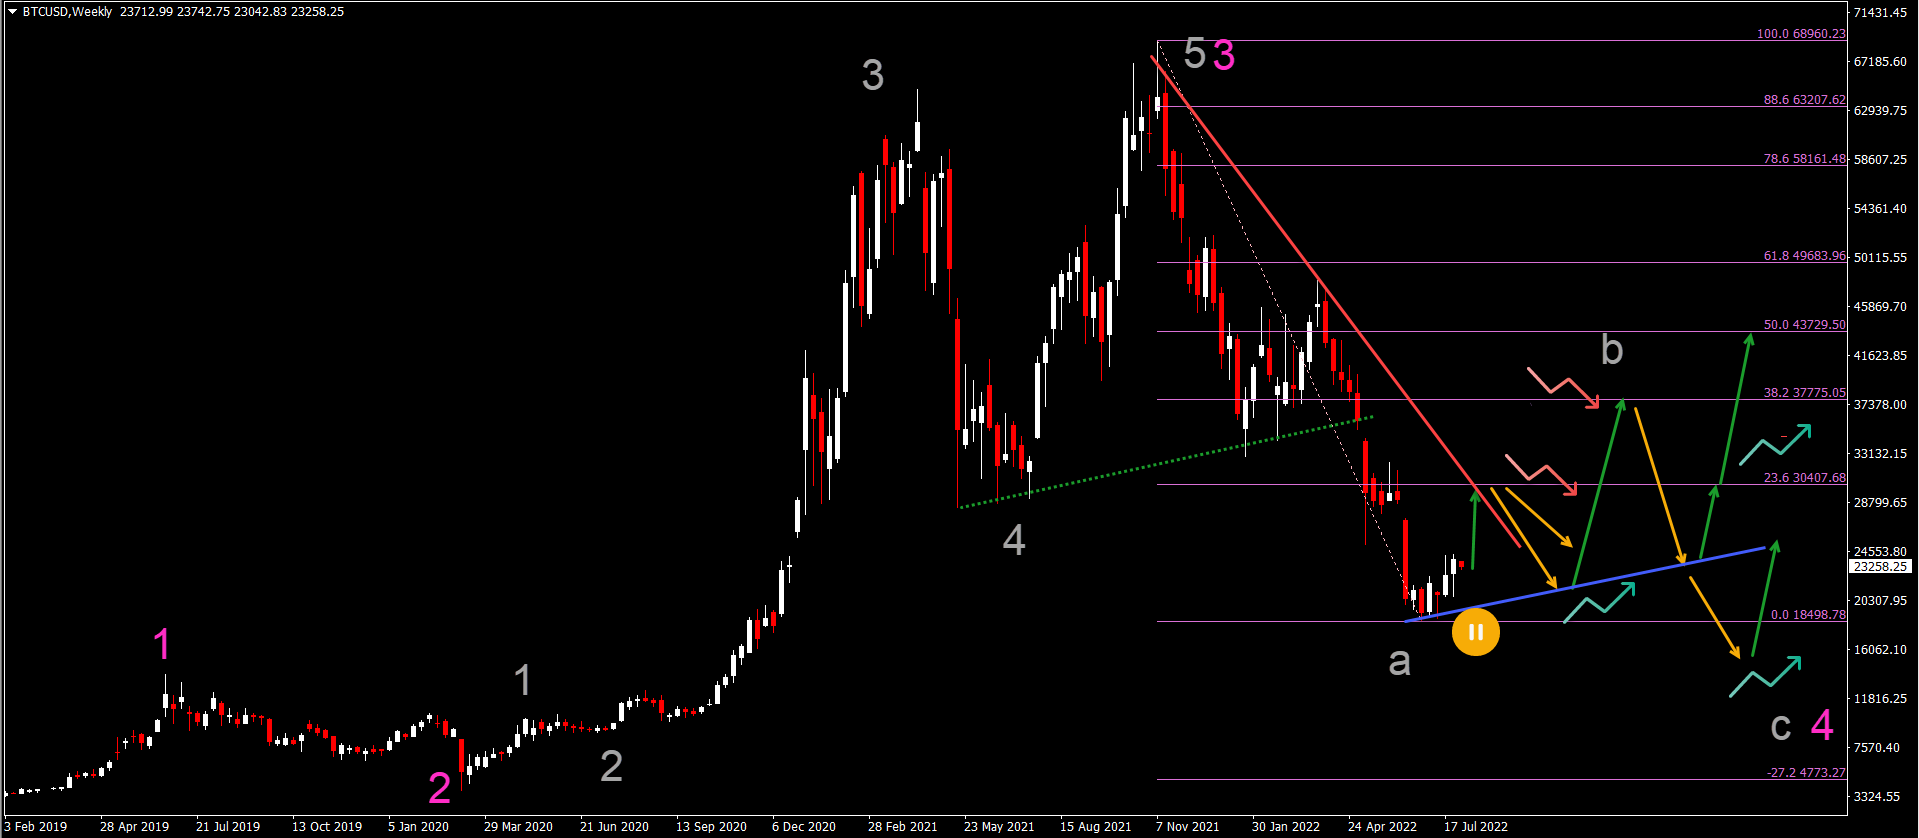
BTC/USD bullish bounce aims at $30k
Bitcoin (BTC/USD) has not made a lower low for at least 4 weeks, which is increasing the chance that the wave A (gray) correction is completed:
-
After completing the potential wave A (gray), the BTC/USD is therefore expected to make a bullish retracement within a wave B (gray).
-
The first target is the 23.6% Fibonacci retracement level near 30k, which is a heavy resistance zone.
-
A bearish bounce is expected at this 23.6% Fibonacci target.
-
A higher low could then confirm a larger ABC (yellow) within wave B (gray).
-
Another bullish push up towards the 38.2% Fibonacci is then expected, which could also be a bearish bouncing spot to test the support again.
-
Price will then either bounce at support for a move up towards the 50% Fibonacci or for a bearish break and a new low.
The analysis has been done with the indicators and template from the SWAT method simple wave analysis and trading. For more daily technical and wave analysis and updates, sign-up to our newsletter
Author

Chris Svorcik
FS method
Chris Svorcik is a trader, analyst, and educator with over 15 years of experience in financial markets, specializing in moving averages, market structure, and price patterns.


