Weekly waves: EUR/USD, Bitcoin and US30
-
The EUR/USD is falling quickly. The price decline was mentioned in last week’s Elliott Wave analysis. Let’s review how far it can decline
-
Bitcoin (BTC/USD) has not yet made a bullish bounce but the bearish price action looks choppy, which could be explained by a falling wedge chart pattern
-
The bearish decline is now testing the support trend line (green). A bearish breakout could indicate a decline towards the 50% Fibonacci level.

Our weekly Elliott Wave analysis reviews the EUR/USD 4 hour chart, the Bitcoin crypto currency daily chart, and US30 on the daily chart.
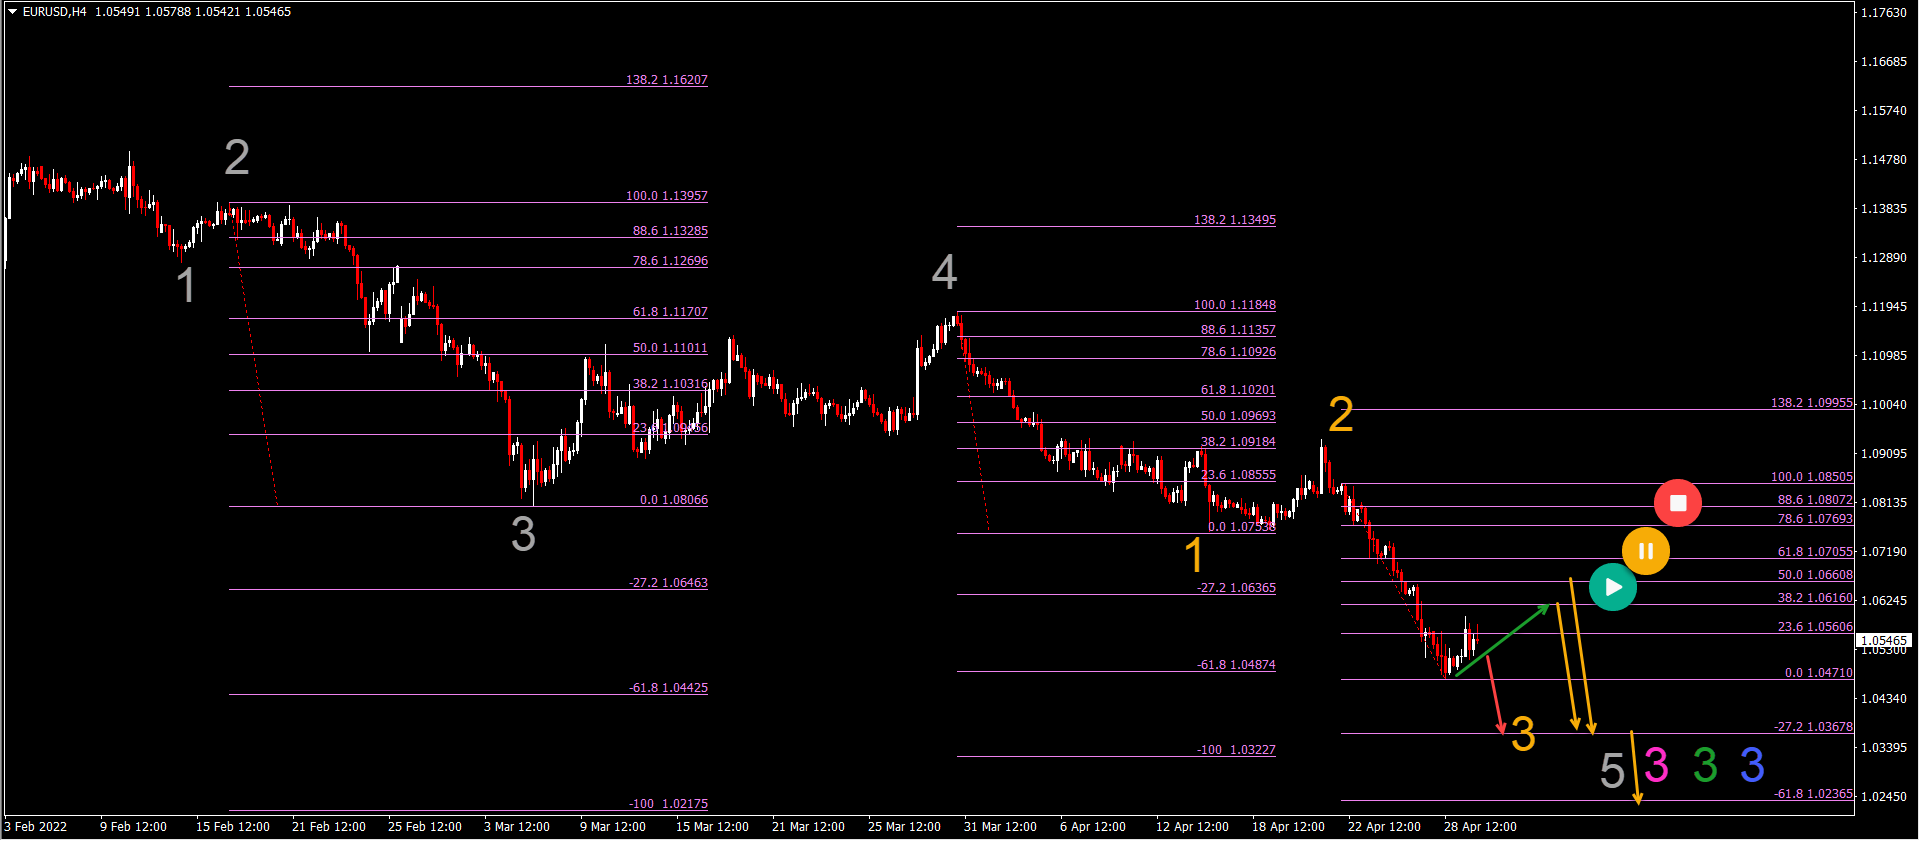
EUR/USD wave 3 creates freefall to 1.05
The EUR/USD is falling quickly. The price decline was mentioned in last week’s Elliott Wave analysis. Let’s review how far it can decline:
-
The EUR/USD decline is part of a wave 3 of wave 3. The bearish impulse has accelerated last week, which is indicating a wave 3 pattern.
-
Price action is building a small pullback but an immediate breakout (red arrow) below the support line (green) is expected at the beginning of May.
-
The main target is the 1.0325-1.0375 zone.
-
If the 1.05 support zone does create a larger bullish pullback, then price action is expected to respect the shallow 38.2% and 50% Fibonacci retracement levels.
-
A bearish bounce and continuation would confirm a wave 4 (orange) pattern.
-
A break above the 1.07-1.0770 resistance places the downtrend analysis on hold.
-
Price action could fall as deep as 1.0250 and 1.00 (parity).
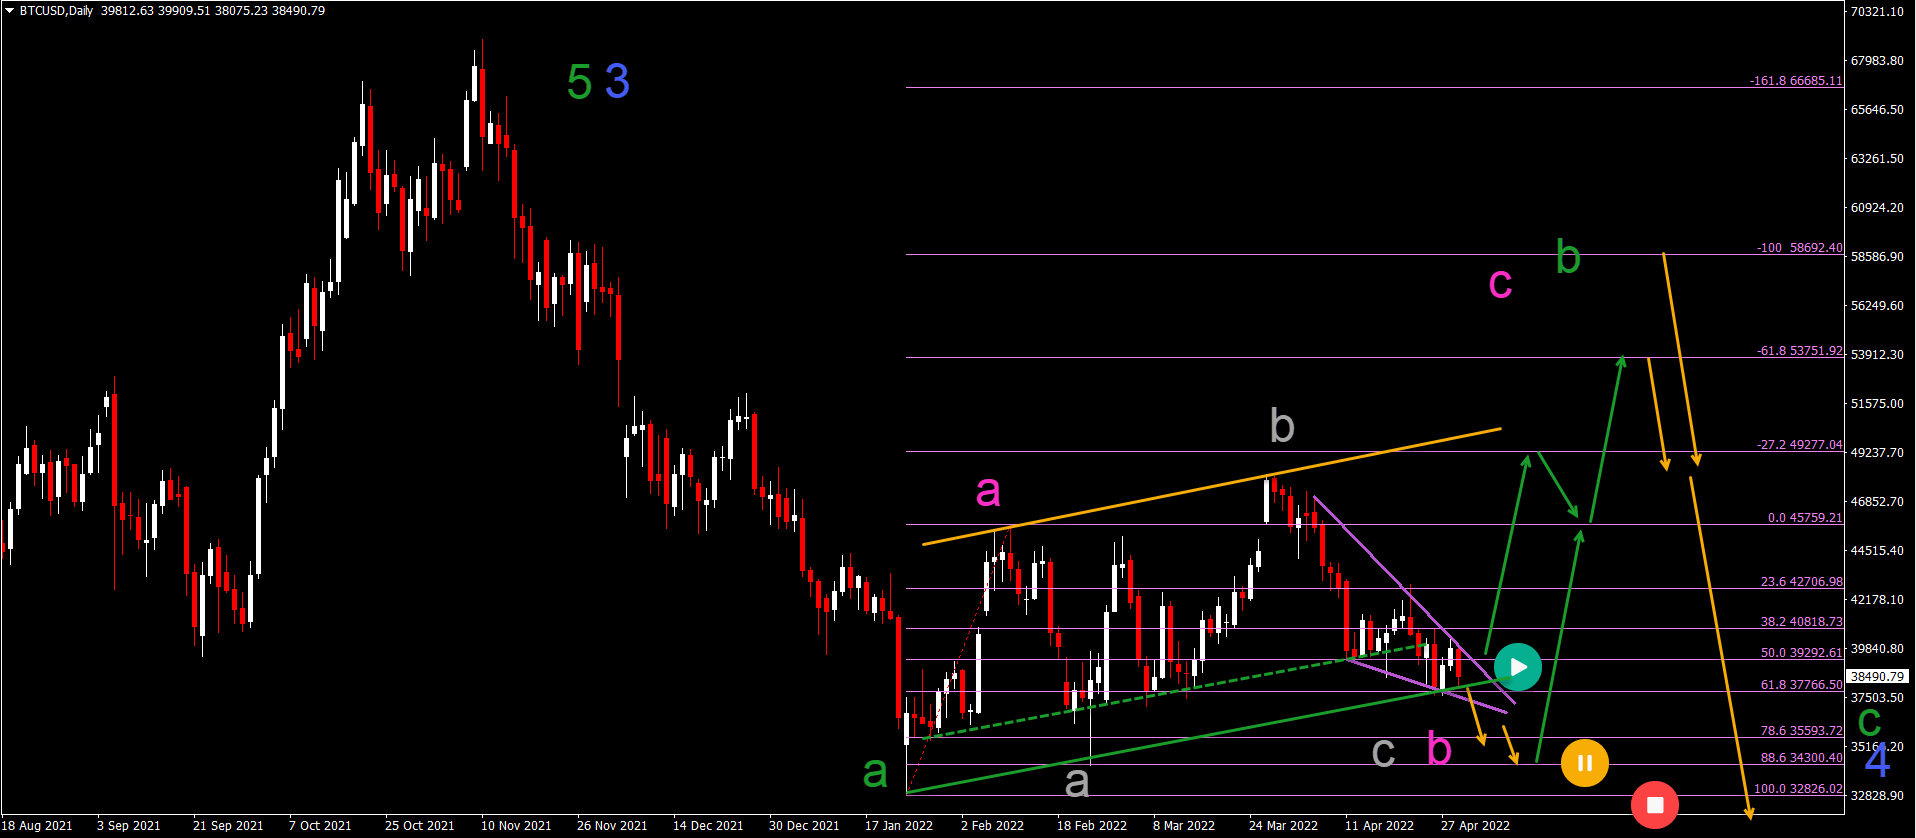
BTC/USD building falling wedge chart pattern
Bitcoin (BTC/USD) has not yet made a bullish bounce but the bearish price action looks choppy:
-
The BTC/USD choppy price action could be explained by a falling wedge chart pattern (purple lines), which often indicates a reversal.
-
A break (green arrow) above the resistance could confirm the bullish price swing and the end of the wave B (pink).
-
A bullish ABC (pink) pattern is expected. A bullish breakout could also indicate the start f% and the wave C (pink).
-
A bearish breakout does invalidate the ABC pattern because the 78.6% and 88.6% Fibonacci levels could act as support.
-
Only a break below the bottom invalidates the bullish ABC pattern.
-
Once price action reaches the Fibonacci targets, a bearish reversal is expected within a wave C (green).
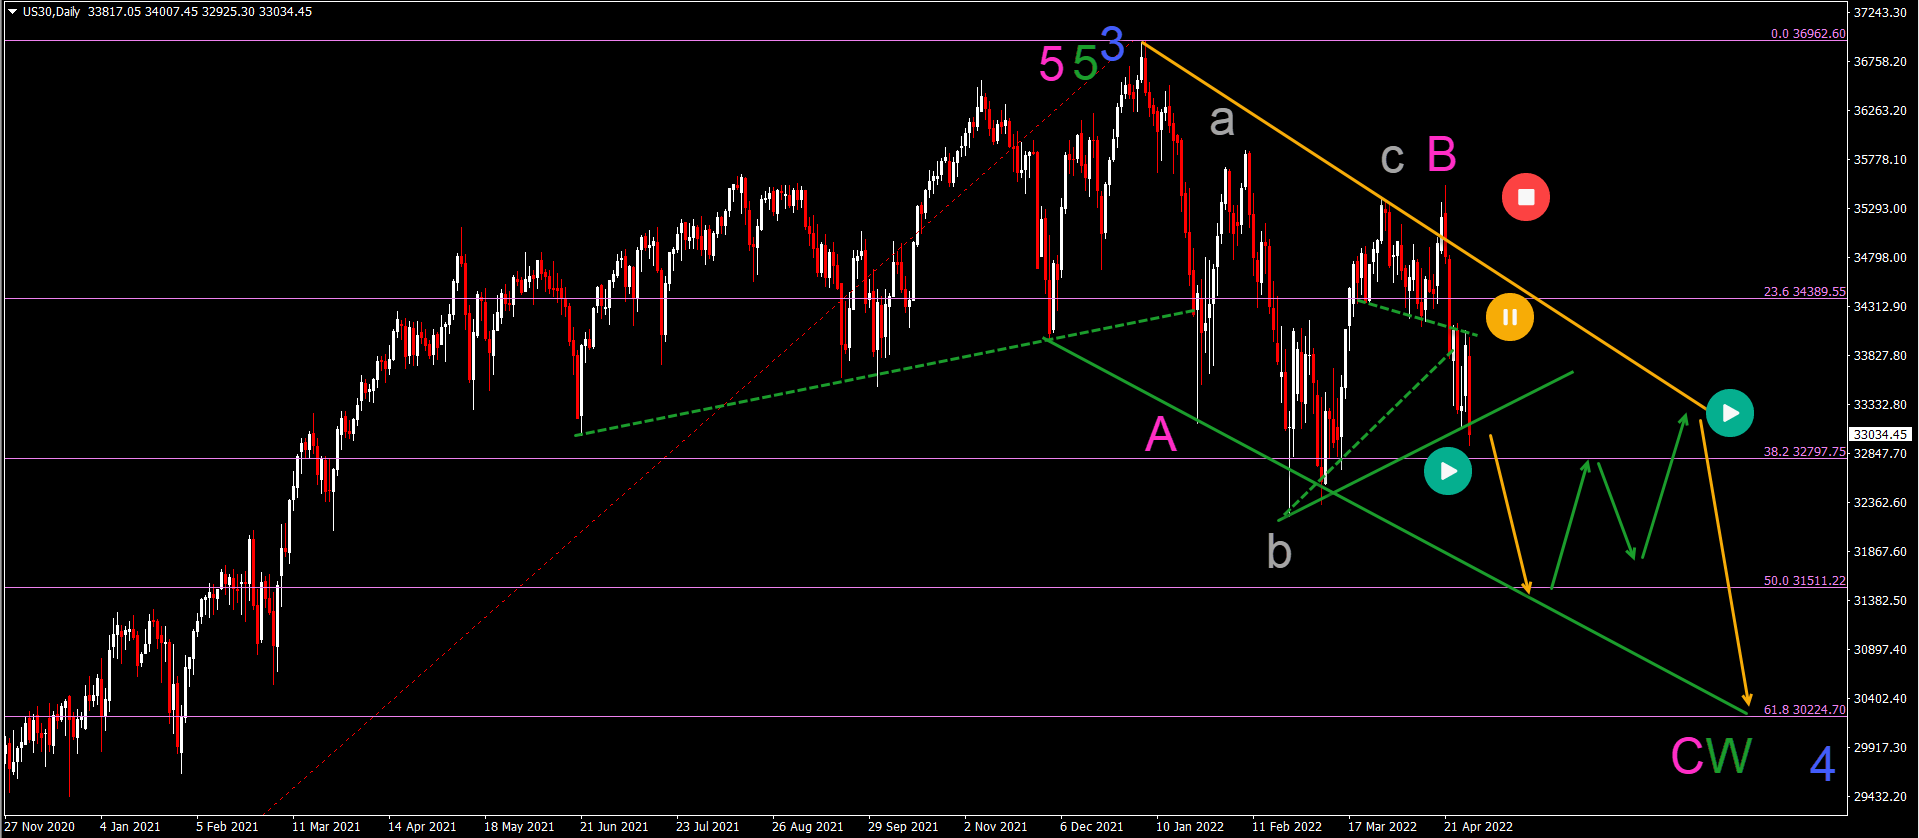
US30 bearish decline continues
The US30 already made a strong bearish bounce two weeks ago. This week the bearish pressure remained visible:
-
The US30 daily chart went up and down during the first 4 trading days last week but ultimately closed in negative territory with the strong bearish Friday candle.
-
The bearish decline is now testing the support trend line (green). A bearish breakout could indicate a decline towards the 50% Fibonacci level.
-
A downtrend is expected to remain in place as long as price action does not break above the resistance (orange) of the downtrend channel.
-
A bearish ABC (pink) pattern is expected within wave W (green) of a larger WXY correction in wave 4 (blue).
The analysis has been done with the indicators and template from the SWAT method simple wave analysis and trading. For more daily technical and wave analysis and updates, sign-up to our newsletter
Author

Chris Svorcik
FS method
Chris Svorcik is a trader, analyst, and educator with over 15 years of experience in financial markets, specializing in moving averages, market structure, and price patterns.


