Weekly COT Report: USD Bulls Shed $10 Billion Of Net Exposure

Read our guide on how to interpret the weekly COT report
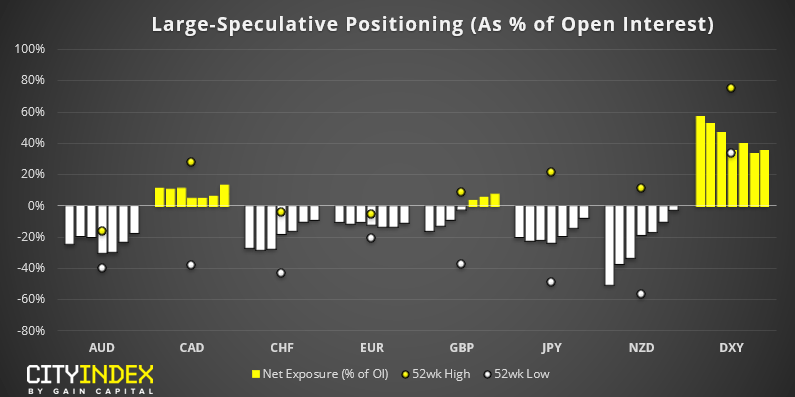
As of Tuesday 7th January:
- Net-long exposure to USD fell to $4.3 billion. At -$10.2 billion from the prior week, it’s the least bullish investors have been to the dollar since June 2018.
- Traders were the most bullish on GBP since May 2018.
- Large speculators were on the cusp of flipping net-long on NZD.
- Traders were their least bearish on JPY in nearly 3-months.
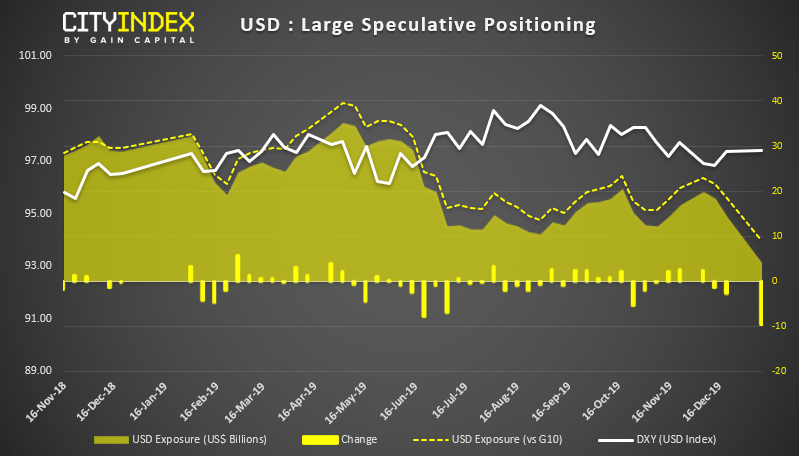
USD: With traders shedding -$10.2 billion in net-long exposure, it’s the largest weekly change since June 2018 and the largest negative decline since June 2015. It’s also the least bullish traders have been on the dollar in 19-months, since traders flipped to net-long. (Not) QE is certainly having an impact on the dollar, or at least traders perception of it, so perhaps this theme will persist until the Fed fix the issues in the repo market.
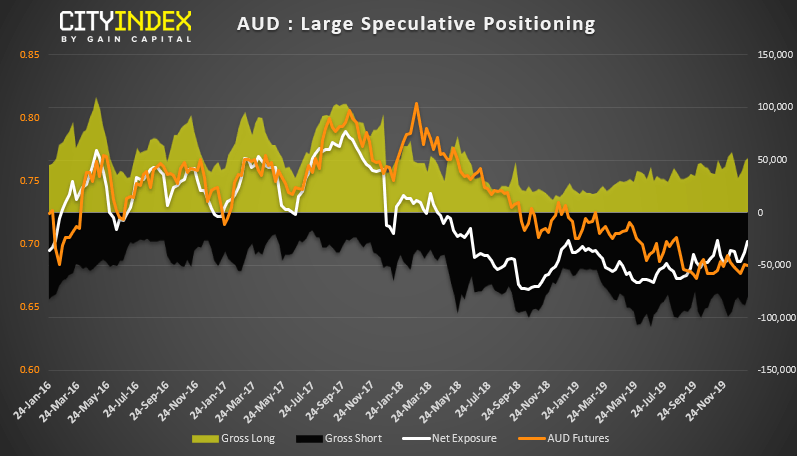
AUD: Net-short exposure has fallen to its lowest level in 2-months, and near similar levels seen in January 2019. And the timing is curious, given the RBA could very well cut rates early February. Still, perhaps this will provide bears with better price to consider short traders, particularly if inflation and / or employment data misses the mark ahead of RBA’s first meeting of the year.
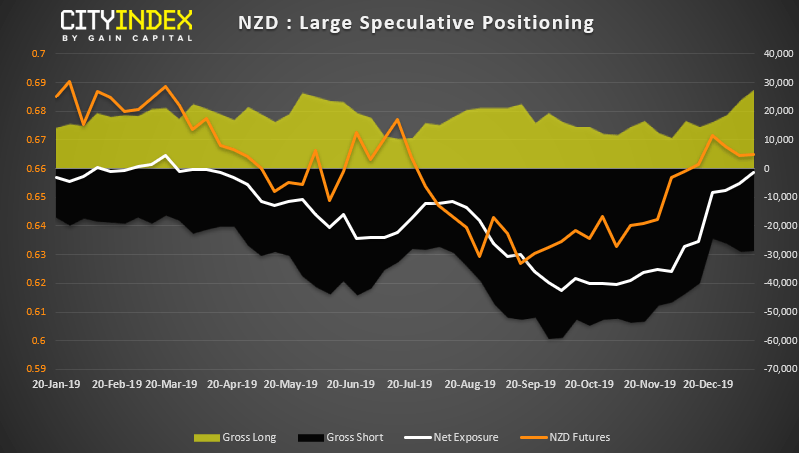
NZD: Traders are on the cusp of flipping to net-long exposure. Moreover, we’ve seen a healthy rise of gross long exposure after shorts were culled between September and December. We continue to expect RBNZ to hold rate through Q1 so core view on NZD remains bullish.
As of Tuesday 7th January:
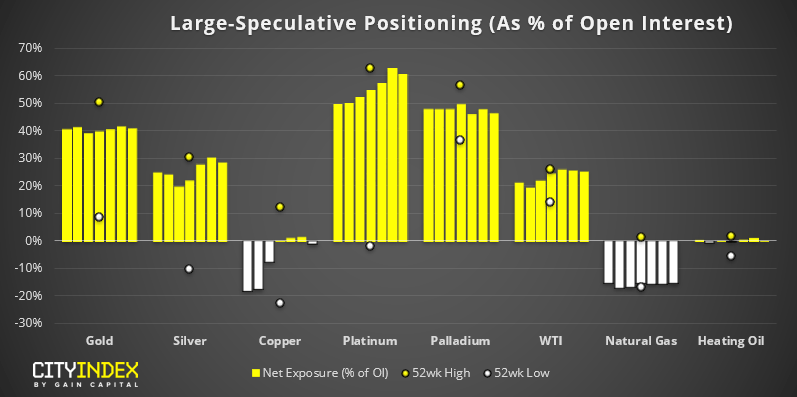
- Copper traders flipped to net-short exposure after just 3-week net long.
- Bullish exposure to platinum hit yet another record high.
- WTI traders were their most bullish since August 2018.
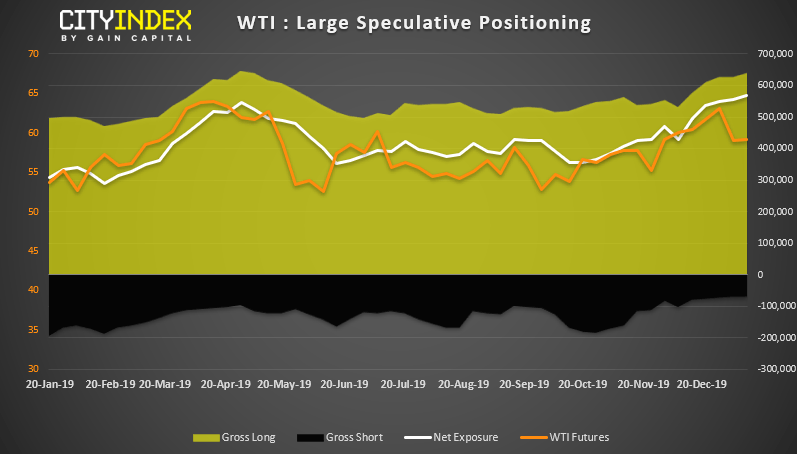
WTI: Whilst traders increased their bullish exposure to a 17-month high, it should be noted that tensions were high in the Middle East which supported oil prices. Yet with WTI’s failure to close above $64 and roll over, it trades back within range and we’d expect positioning to reflect this in the next report. This means range-trading strategies are preferred whilst prices remain below $64 - $65.
Author

Matt Simpson, CFTe, MSTA
CityIndex
Matt Simpson is a certified technical analyst who combines charts and fundamentals to generate trading themes.


