US Dollar Weakens After Fed Launches Unlimited QE

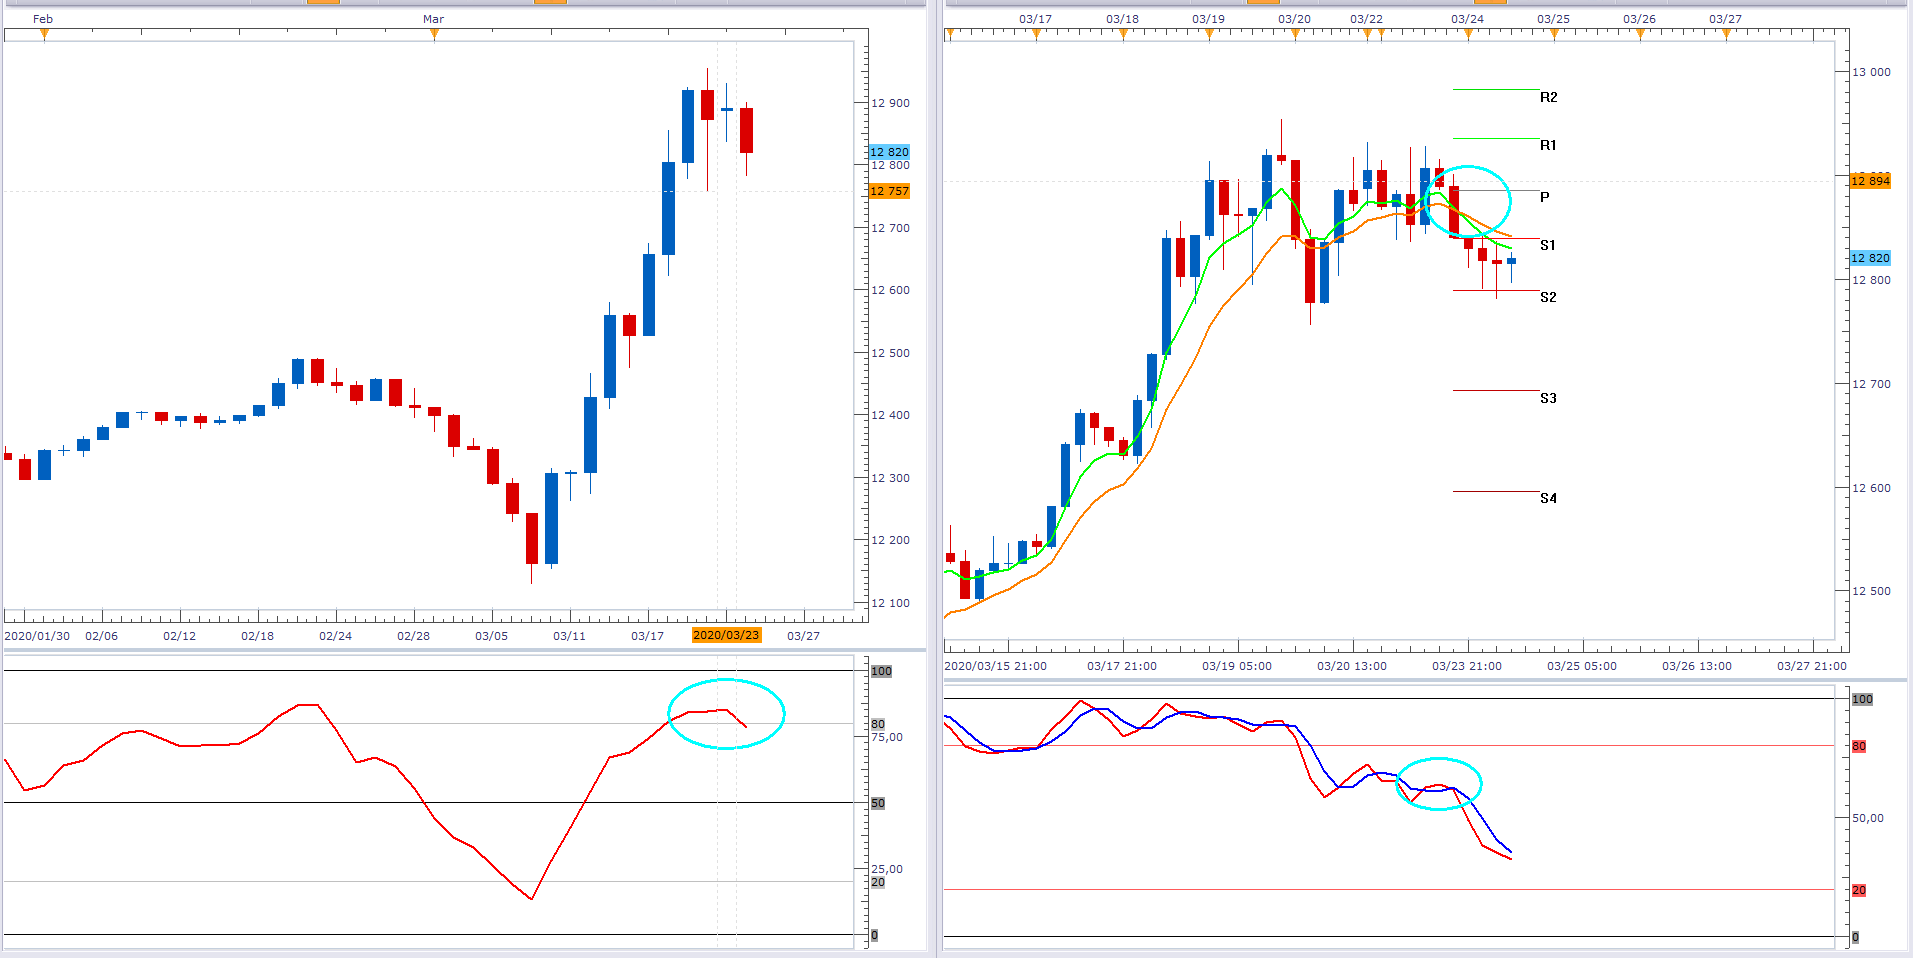
The below left is the daily time frame of FXCM's USDOLLAR index. After a parabolic rise since 10 March, the greenback is holding at 12,825. The daily RSI is overbought (aqua ellipse) and is likely to normalise in the near term. The right chart shows the index's H4 time frame. Here the green 5-period EMA has crossed below the orange 10-period EMA and the stochastic has turned down. These are bearish developments as the market digests the Fed's announcement yesterday to backstop the US economy and launch unlimited QE. If the EMAs develop further angle and separation it will likely be on the back of further buck weakness.
Past performance is not an indicator of future results
CHART SOURCE: FXCM MARKETSCOPE 2.0
Author

Russell Shor (MSTA, CFTe, MFTA) has an Honours Degree in Economics from the University of South Africa and holds the coveted Certified Financial Technician and Master of Financial Technical Analysis qualifications from the Interna


