|

US Dollar Has Work to Do to Continue Outperformance of XAU/USD on Daily Time

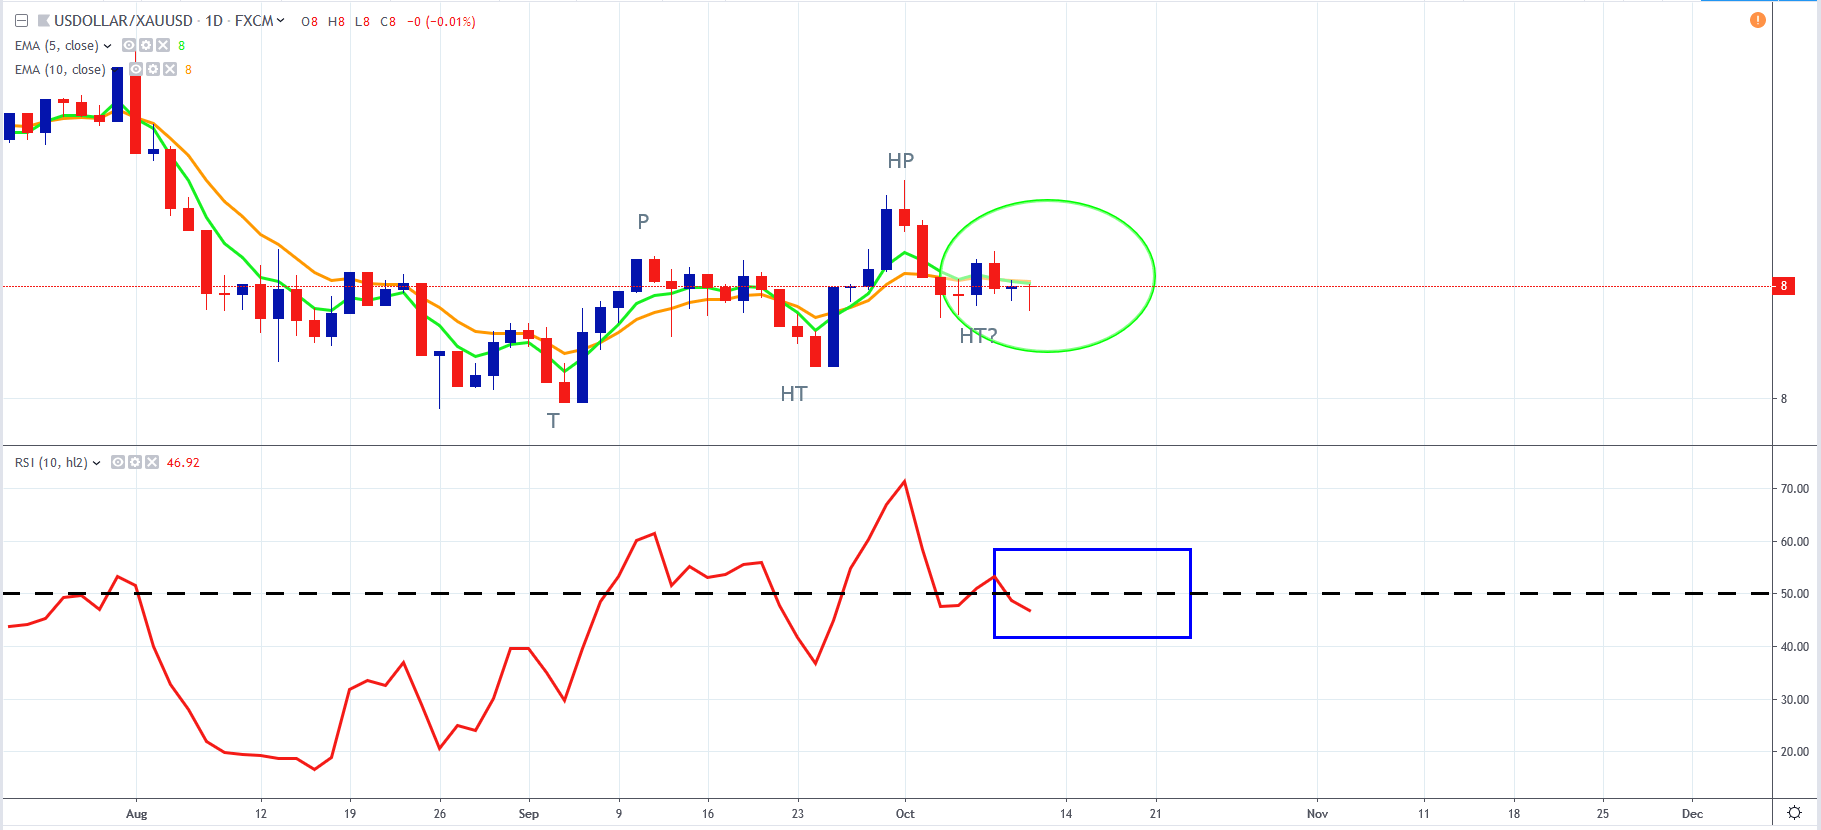
The below is the daily relative strength chart of the USDOLLAR to XAUUSD. We note that a higher trough (HT) followed by a higher peak (HP) has charted. This is the classical definition of an uptrend. We are now assessing if another higher trough (HT?) in the series is charting. If the green 5-day EMA crosses above the orange 10-day EMA (green ellipse) and the RSI moves above 50 (blue rectangle), these will be regarded as bullish developments. However, for the greenback to continue its outperformance of the precious metal, the EMAs will also need to develop angle and separation to the upside. We continue to monitor.

Past performance is not an indicator of future results.
CHART SOURCE: www.tradingview.com

US Dollar

Author

Russell Shor, CFTe, MFTA

Russell Shor (MSTA, CFTe, MFTA) has an Honours Degree in Economics from the University of South Africa and holds the coveted Certified Financial Technician and Master of Financial Technical Analysis qualifications from the Interna

More from Russell Shor, CFTe, MFTA
Share:

Editor's Picks

EUR/USD treads water above 1.1850 amid thin trading

EUR/USD stays defensive but holds 1.1850 amid quiet markets in the European hours on Monday.  The US Dollar is struggling for direction due to thin liquidity conditions as US markets are closed in observance of Presidents' Day. 

GBP/USD flat lines as traders await key UK and US macro data

GBP/USD kicks off a new week on a subdued note and oscillates in a narrow range near 1.365 in Monday's European trading. The mixed fundamental backdrop warrants some caution for aggressive traders as the market focus now shifts to this week's important releases from the UK and the US.

Gold slides below $5,000 amid USD uptick and positive risk tone; downside seems limited

Gold attracts fresh sellers at the start of a new week and reverses a part of Friday's strong move up of over $150 from sub-$4,900 levels. The commodity slides back below the $5,000 psychological mark during the Asian session, though the downside potential seems limited amid a combination of supporting factors.

Bitcoin, Ethereum and Ripple consolidate within key ranges as selling pressure eases

Bitcoin and Ethereum prices have been trading sideways within key ranges following the massive correction. Meanwhile, XRP recovers slightly, breaking above the key resistance zone. The top three cryptocurrencies hint at a potential short-term recovery, with momentum indicators showing fading bearish signs.

Global inflation watch: Signs of cooling services inflation

Realized inflation landed close to expectations in January, as negative base effects weighed on the annual rates. Remaining sticky inflation is largely explained by services, while tariff-driven goods inflation remains limited even in the US.

Ripple Price Forecast: XRP potential bottom could be in sight

Ripple edges up above the intraday low of $1.35 at the time of writing on Friday amid mixed price actions across the crypto market. The remittance token failed to hold support at $1.40 the previous day, reflecting risk-off sentiment amid a decline in retail and institutional sentiment.