|

USD/SGD Elliott Wave: Calling the decline from the extreme zone

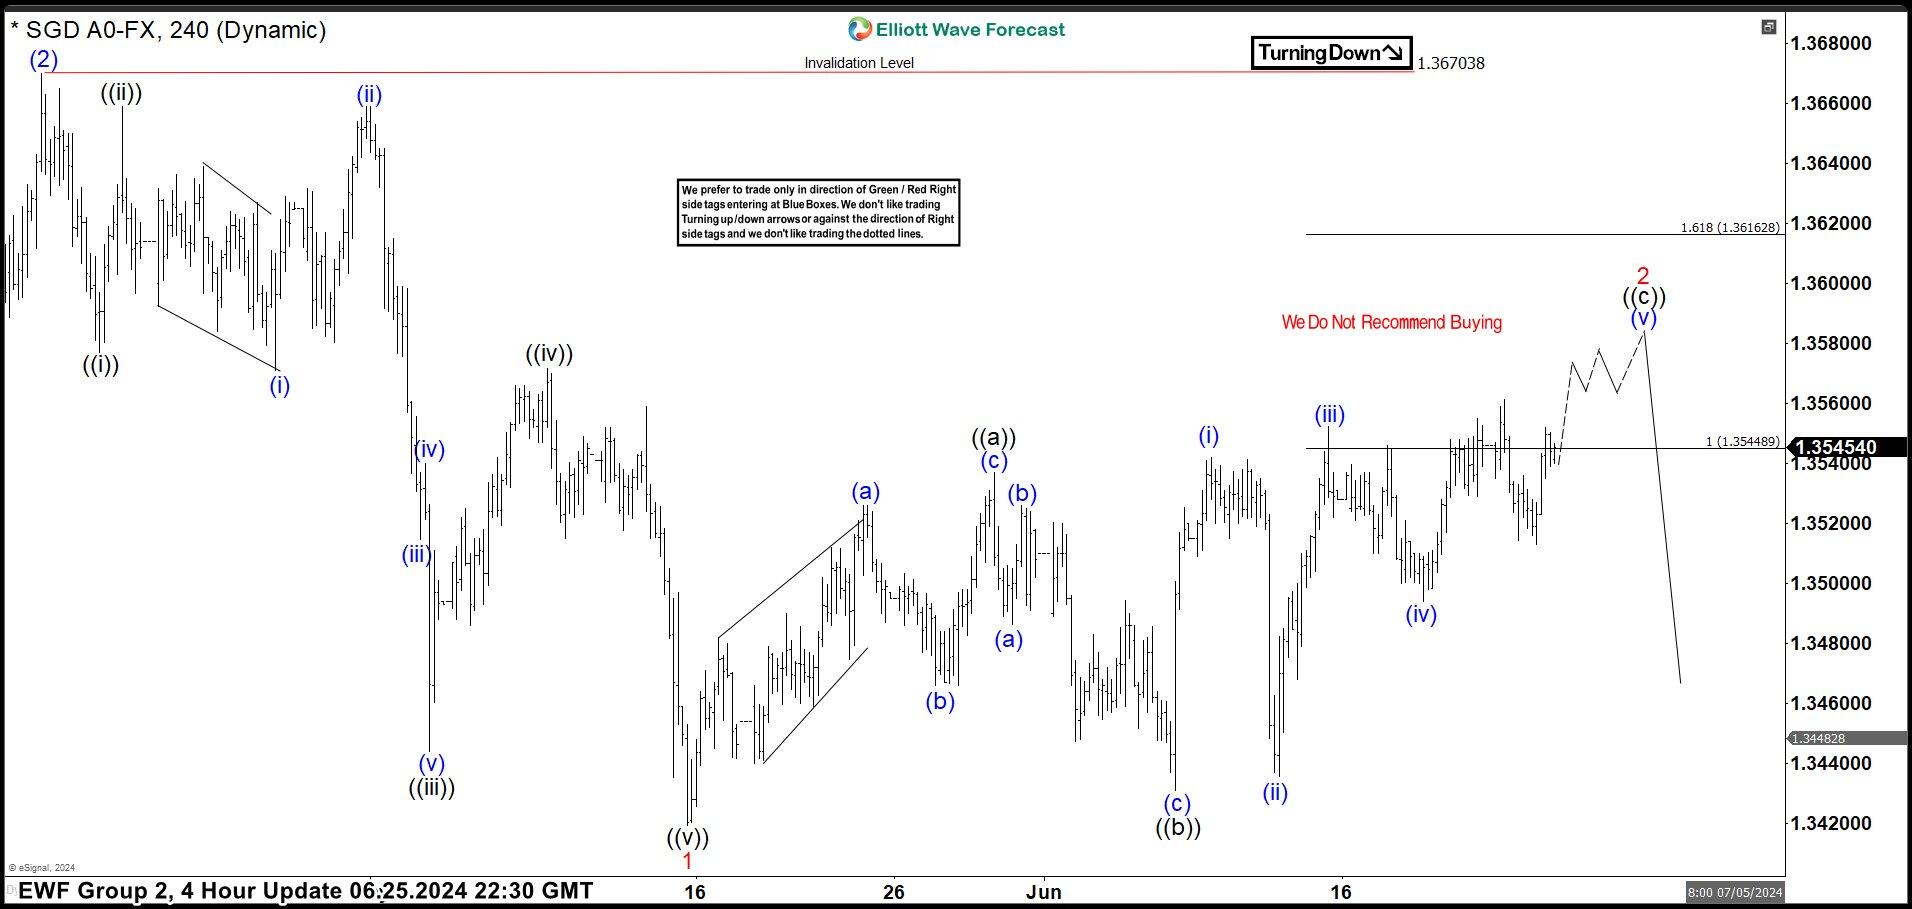
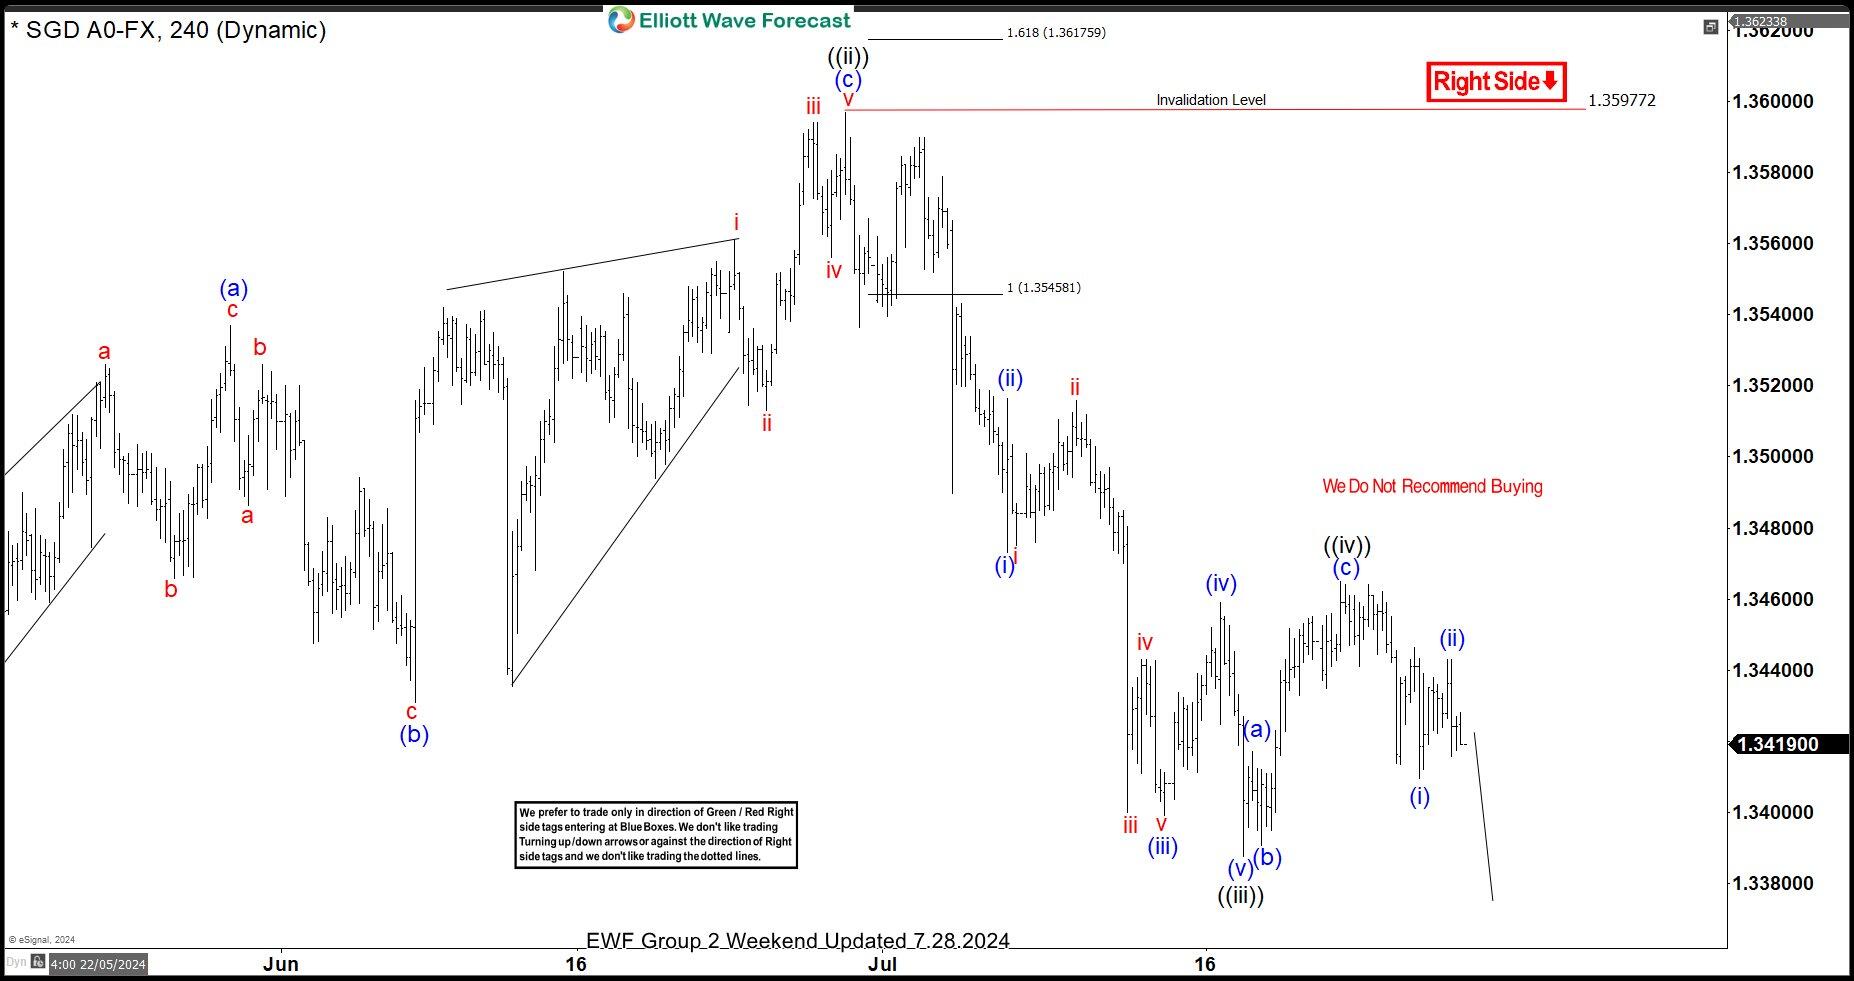
In this technical article we’re going to take a quick look at the Elliott Wave charts of USDSGD Forex pair , published in members area of the website. As our members know, USDSGD has recently given us 3 waves recovery against the 1.36703 peak. The pair has made a bounce in a 3-wave pattern, when sellers appeared right at the equal legs zone. Let’s break down our Elliott Wave forecast further in this article.

Chart
Chart

Author

Elliott Wave Forecast Team

Elliott Wave Forecast Team

ElliottWave-Forecast.com

More from Elliott Wave Forecast Team
Share:

Editor's Picks

EUR/USD looks offered below 1.1900

EUR/USD keeps its bearish tone unchanged ahead of the opening bell in Asia, returning to the sub-1.1900 region following a firmer tone in the US Dollar. Indeed, the pair reverses two consecutive daily gains amid steady caution ahead of Wednesday’s key US Nonfarm Payrolls release.
 

GBP/USD slips back to daily lows near 1.3640

GBP/USD drops to daily lows near 1.3640 as sellers push harder and the Greenback extends its rebound in the latter part of Tuesday’s session. Looking ahead, the combination of key US releases, including NFP and CPI, alongside important UK data, should keep the pound firmly in focus over the coming days.

Gold the battle of wills continues with bulls not ready to give up

Gold remains on the defensive and approaches the key $5,000 region per troy ounce on Tuesday, giving back part of its recent two day. The precious metal’s pullback unfolds against a firmer tone in the US Dollar, declining US Treasury yields and steady caution ahead of upcoming key US data releases.

Bitcoin's downtrend caused by ETF redemptions and AI rotation: Wintermute

Bitcoin's (BTC) fall from grace since the October 10 leverage flush has been spearheaded by sustained ETF outflows and a rotation into the AI narrative, according to Wintermute.

Dollar drops and stocks rally: The week of reckoning for US economic data

Following a sizeable move lower in US technology Stocks last week, we have witnessed a meaningful recovery unfold. The USD Index is in a concerning position; the monthly price continues to hold the south channel support.

XRP holds $1.40 amid ETF inflows and stable derivatives market

Ripple trades under pressure, with immediate support at $1.40 holding at the time of writing on Tuesday. A recovery attempt from last week’s sell-off to $1.12 stalled at $1.54 on Friday, leading to limited price action between the current support and the resistance.