|

USD/CHF Elliott Wave: How we identified the bullish setup near 0.8200 [Video]

In our webinar on Monday, we discussed the bullish outlook for the US dollar after US yields broke higher following the Fed rate hike on September 9. We looked at several currency pairs that could offer interesting opportunities on the long USD side, with a particular focus on USD/CHF.
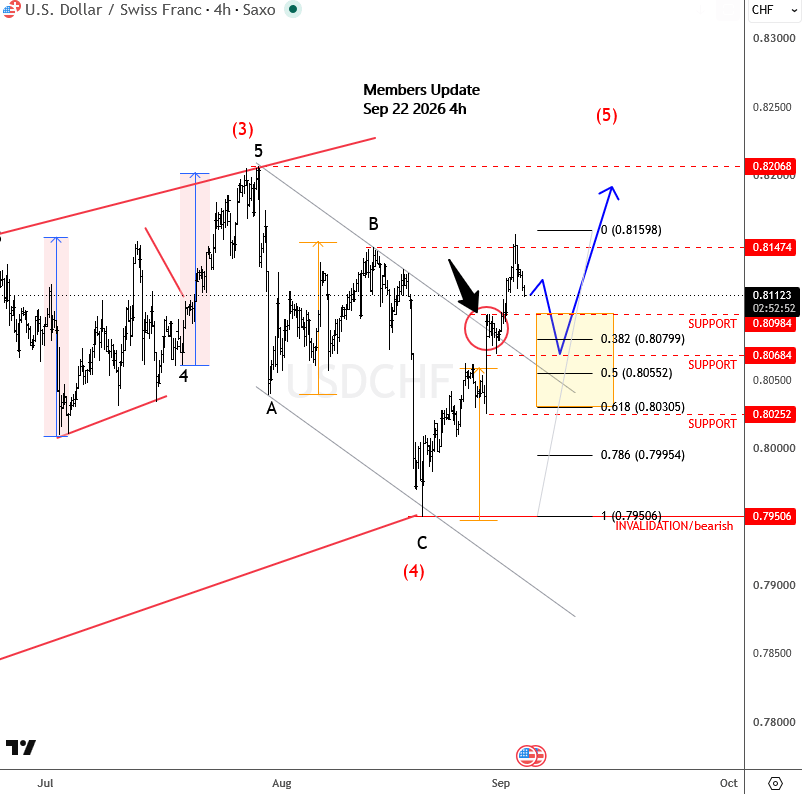
USDCHF4H
USDCHF 4H Chart September 03 Update

The Swiss National Bank is not as hawkish as some other major central banks. In fact, the SNB recently said that it remains willing to intervene in the FX market if the Swiss franc strengthens too much. This keeps us cautious on CHF, while on the other side we remain bullish on the US dollar, especially as the Fed has indicated that further rate hikes may still be needed.
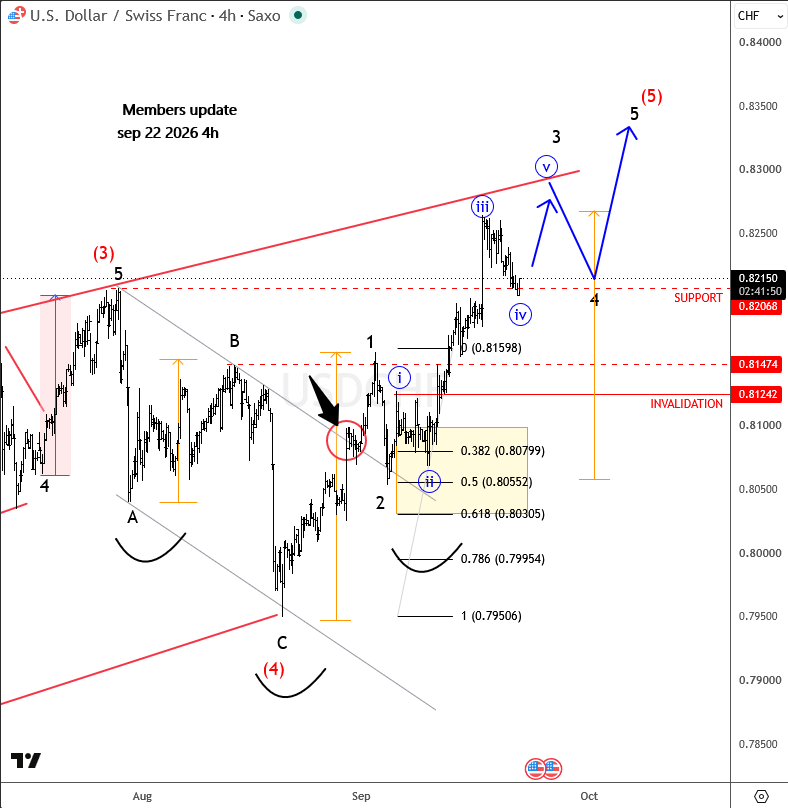
USDCHF 4H Chart September 22 Update

In the webinar, we specifically highlighted the 0.8200 area. This was the August 5 high that had recently been broken, before USDCHF pulled back in three waves to retest that level. From a simple technical perspective, this can be viewed as previous resistance turning into support. However, when we combine this level with the Elliott Wave structure, it becomes even more interesting. The recovery from the lows is impulsive, while the pullback into 0.8200 was corrective, suggesting that the broader bullish trend could resume.
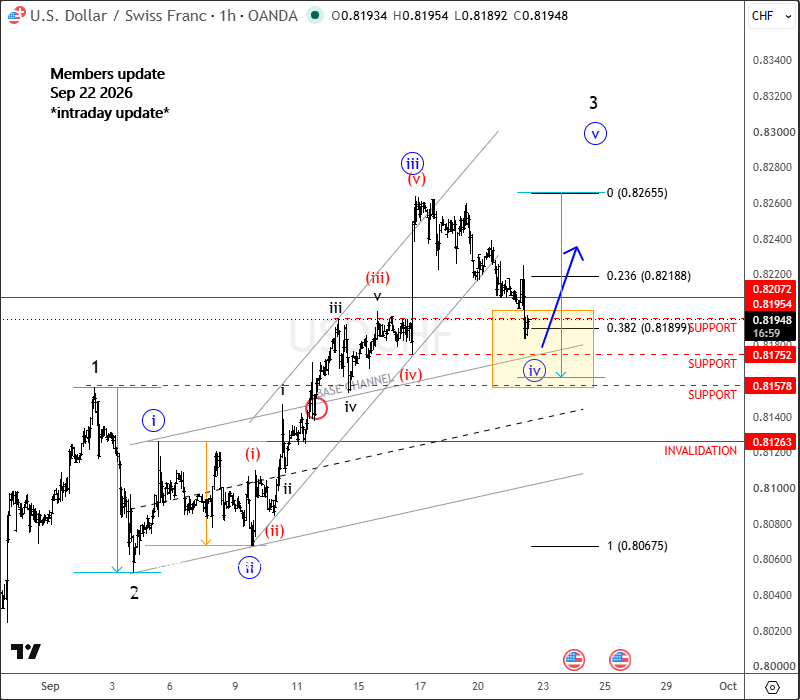
USDCHF 1H Chart September 22 Update

We were therefore looking for more upside in wave three and later another opportunity to catch wave five. As you can see on the charts below, USDCHF has already extended to new highs. The 0.8155–0.8200 yellow support zone provided a very nice reaction and was an important area to watch for potential bullish opportunities.
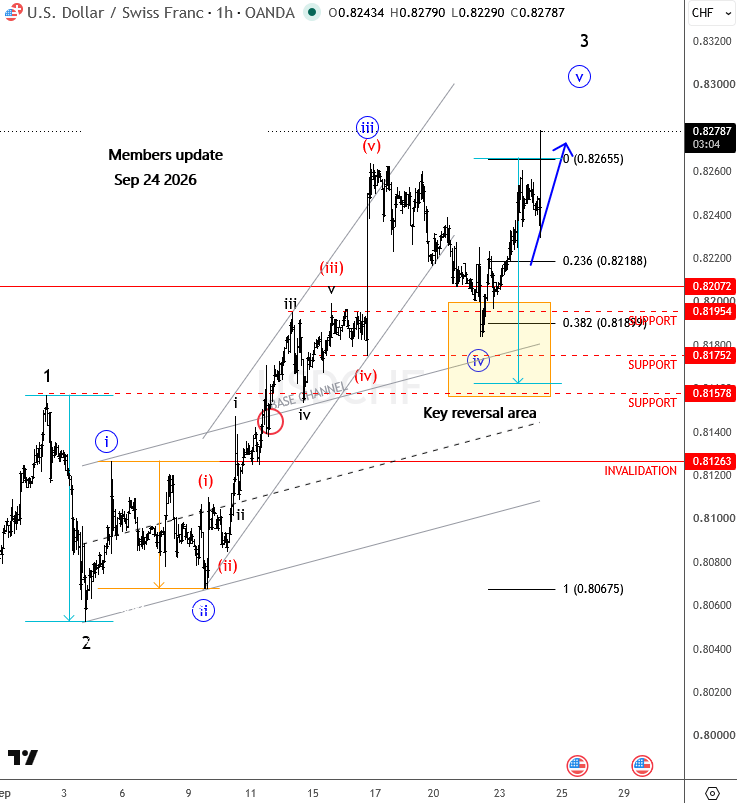
USDCHF 1H Chart September 24 Update

This is exactly why we use yellow boxes in our analysis. Sometimes Grega will share his own trades through our Trading Notes, but even when he does not personally take a trade, members can use these highlighted reversal zones to identify potential opportunities based on the Elliott Wave structure. Not every analysis will produce a trading opportunity, but some wave patterns are much clearer than others, and our goal is to highlight the setups with the strongest technical potential.

For more analysis like this, you may want to join our live webinar today on Monday, September 28 @ 15.00CET:

Youtube preview

Get Full Access To Our Premium Elliott Wave Analysis For 14 Days. Click here.

Author

Gregor Horvat

Gregor Horvat

Wavetraders

Experience Grega is based in Slovenia and has been in the Forex market since 2003.

More from Gregor Horvat
Share:

Editor's Picks

AUD/USD defends 0.7000 ahead of RBA on Tuesday

AUD/USD is defending 0.7000 at the start of a new week, trading near its lowest level since August 4 amid a bullish US Dollar. US yields hold near multi-year highs amid inflation risks from higher oil prices and rising bets on an October Fed rate hike. This, along with the US-Iran standoff, continues to underpin the safe-haven buck and weigh on the pair ahead of Tuesday's RBA policy announcements.

USD/JPY climbs back toward 158.00 after BoJ minutes amid firm USD

USD/JPY finds dip-buyers and reverses part of Friday's slide driven by speculation that authorities will step in again to prop up the Japanese Yen. However, the BoJ's dovish Minutes cap the JPY. Meanwhile, the US Dollar regains traction as the US-Iran standoff supports crude oil prices, fueling inflation fears and reaffirming bets for an October Fed rate hike. This further supports the pair, driving it back toward 158.00.

Gold sheds 3%, eyeing $4,100 on renewed US-Iran risks

Gold is falling hard at the start of a new week, targeting $4,100 for the first time in eight weeks. Firming October Fed rate-hike bets, along with oil-driven inflation risks, keep US bond yields elevated near multi-year highs, helping the US Dollar hold firm, particularly after Trump rejected Iran's truce offer. These factors weigh heavily on the bullion.

Zcash risks a decline below $1,500 as bullish momentum eases

Zcash price hovers below $1,550 on Monday, extending losses after a 4% decline the previous day. Institutional interest in the privacy coin holds firm, recording over $35 million in inflows last week, while retail speculation takes a hit, with ZEC futures Open Interest down around 10% in 24 hours.

Data back in the driver’s seat this week
Markets will look for fresh evidence of a hot US economy from this week as September figures start to flow in. Upside surprises in jobs data could take rate hike pricing for the October FOMC above 20bp. It’s not our baseline though, and we expect some stabilisation with modest downside risks for USD in the coming days. We expect a hawkish hike by the RBA tomorrow.
Fed vs BoJ: Both hiked. The market only believes one of them – and the chart shows which

The Fed and the BoJ have just done something remarkably similar. Both central banks raised interest rates by 25 bps last week, both are confronting inflation risks, and both signal that future decisions will depend on incoming economic data.