USD/CAD under pressure as markets monitor US-Iran ceasefire

USD/CAD has maintained a 3 day losing streak after the ceasefire agreement between the US and Iran on Wednesday triggered risk-on sentiment across the markets. The decision saw the US dollar’s safe haven demand erode as other major assets strengthened against it.
The dollar index (DXY), after failing to make it above 100.50, fell sharply with its price now oscillating between 98.50 and 99.00. Oil prices also took a massive hit after the ceasefire agreement was announced.The UK Brent dipped over 10% from its weekly high at $111.89 to $90.70 but has trimmed some of its loses as Iran accuses the US of violating the ceasefire agreement due to Israel’s recent strikes on Lebanon and has suspended traffic movement across the Strait of Hormuz with threats to pull out of the ongoing negotiation with Washington.
From the perspective of Economic data reports, The Federal Reserve reiterated its commitment to increase rates later in the year as they expect higher energy price due to the Iran war to keep inflation figures at elevated levels. On Friday, April 9, 2026, the US inflation report will be due alongside the Employment Change report from Canada.
Technical outlook
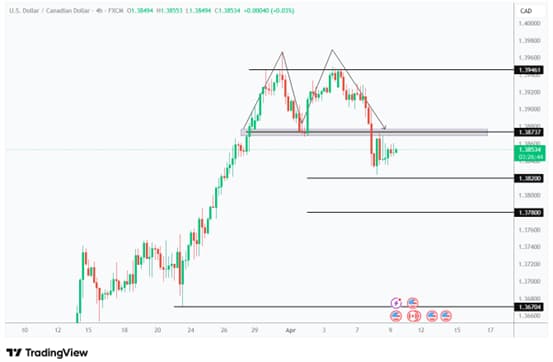
The structure on the 4-hour chart of USDCAD shows a transition from a bullish momentum into a bearish reversal structure after printing out a Double top chart pattern with a break of the neckline at 1.3873. The current retest of the neckline indicates a classic support-turned- resistance retest and we could see traders aim for shorts around this level.
For now, the bias on USDCAD remains bearish given the current market structure. If the price fails to reclaim 1.3873, then we could see a drop towards 1.3820 which is the near-term support level before deeper continuation towards 1.3780 and the extended target at 1.3670.
Author

Erastus Adegbotolu
TradingPRO
Forex market analyst and educator with a strong focus on technical analysis and trader psychology.