USD/CAD Long-term Forecast: Loonie seen strengthening with Stochastics in Overbought band

The USD/CAD is trading down on 2017 basis with the currency pair swinging higher to form the 2017 peak of C$1.3787. Loonie recovered swiftly from May to the middle of September with the US President Trump losing the ground on many political fronts in the USA.
After forming a cyclical bottom at C$ 1.2097 on September 12 this year, the US Dollar gained back some ground retreating up to C$1.2919 during the second half of November.
Since late November the trend on USD/CAD is sideways within a broader range of three big figures of C$ 1.2620-C$1.2930.
While the oil price increasing supported typically commodity based Canadian economy and its Dollar, current stagnation on oil prices is negative for Canadian Dollar.
Fundamental outlook
While Canadian growth rate is expected to slow to 2.1% and 1.9% in 2018 and 2019 respectively, according to OECD, the US growth is expected to accelerate, boosted by short-term boom stemming from upcoming individual and corporate tax reduction in the US.
The US GDP is projected to rise 2.5% in 2018 and decelerate to 2.1% in 2019 according to latest from the US Federal Reserve.
In terms of interest rate differential, both the US Federal Reserve and the Bank of Canada kept monetary tightening in 2017. While the US Fed increased the target range three times in 2017, the Bank of Canada hiked interest rates twice by 25 basis points to 1.0%.
The outlook for monetary policy normalization is in place in both countries, with the US Fed seen rising rates another three times in 2018 while the Bank of Canada is expected to deliver another two rate hikes in 2018.
Technical outlook
Fundamentally the growth differential and interest rate outlook both play in favor of the US Dollar long-term, but technically, the picture favors CAD.
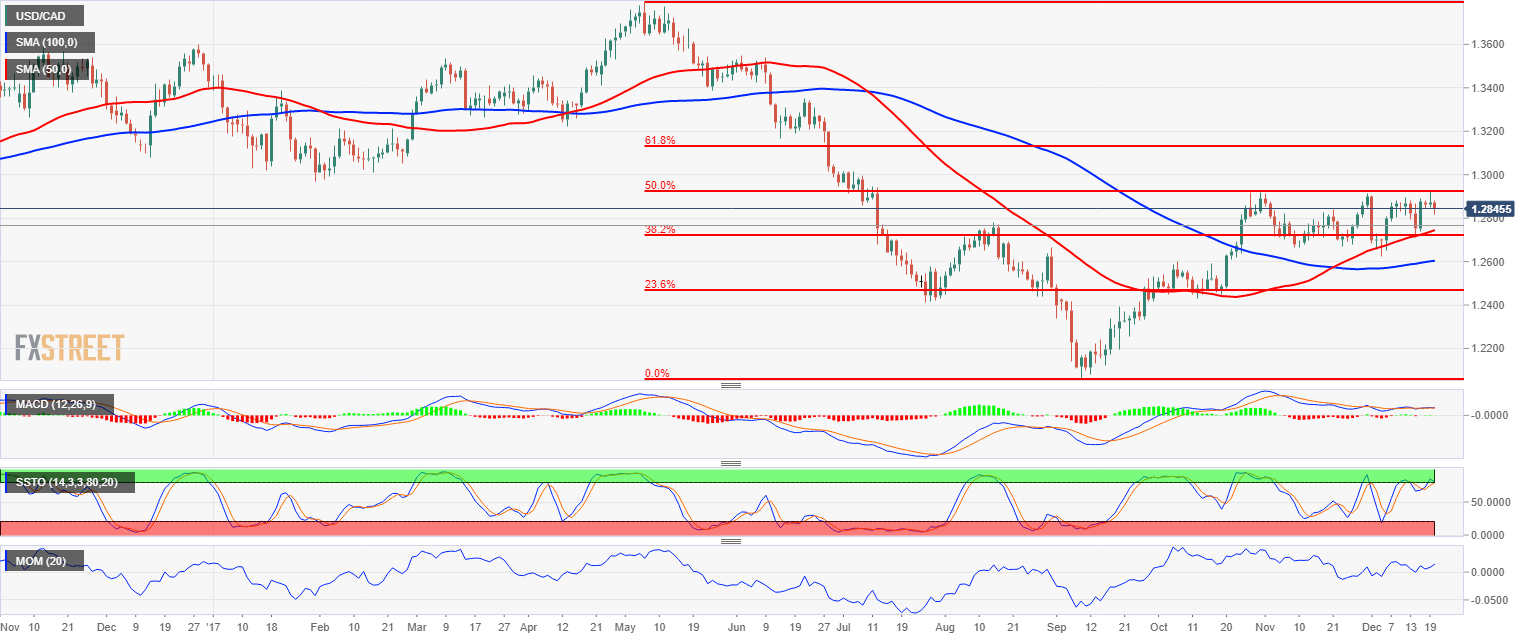
The current trend on USD/CAD is sideways with the exchange rate moving within C$1.2720 represented on the downside by 38.2% Fibonacci retracement of long-term appreciation of Loonie towards C$1.2097 cyclical low and C$1.2920 represented by 50% Fibonacci retracement of the same move.
With Momentum in positive territory and MACD neutral, the Slow Stochastic crossover within the Overbought territory is a sign of further potential on the downside with the move facing C$1.2720 Fibonacci support first before targeting 28.2% Fibonacci retracement at C$1.2470.
Author

Mario Blascak, PhD
Independent Analyst
Dr. Mário Blaščák worked in professional finance and banking for 15 years before moving to journalism. While working for Austrian and German banks, he specialized in covering markets and macroeconomics.


