|

US10Y price outlook: US government bonds 10 YR yield navigating between arc levels

US government bonds 10 YR yield (US10Y): Arc cycle analysis
Chart
Chart

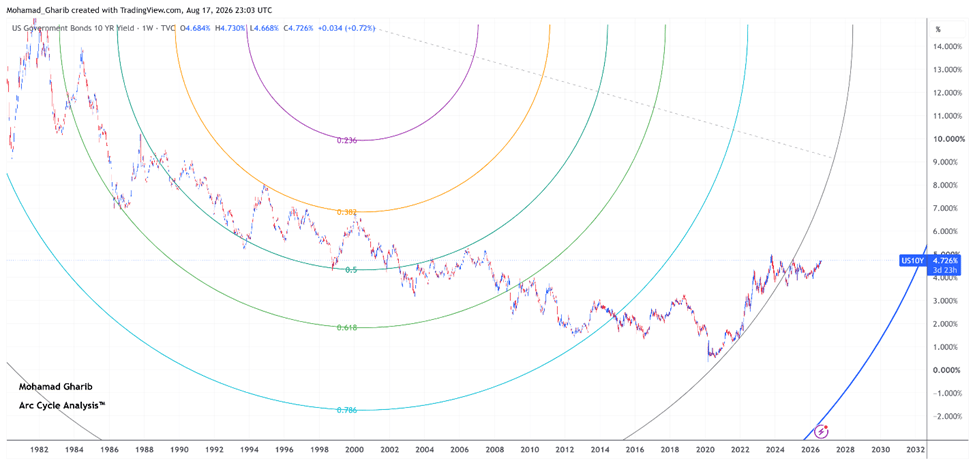
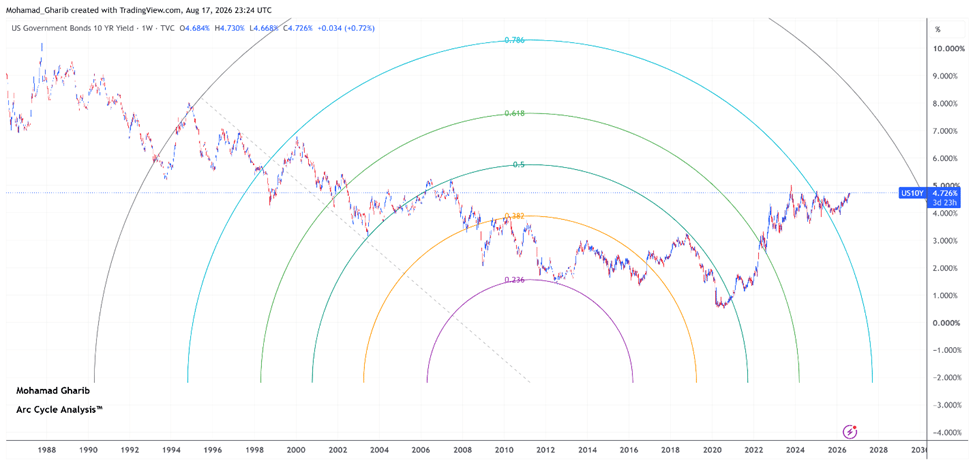
Overview: Based on Arc Cycle Analysis applied to the 1W chart, the 10-Year US Treasury Yield have cleared the 0.786 Arc boundary and are progressing toward the 1 (100%) Arc, suggesting continued movement toward the next Arc expansion level..

Metric

Reading

 Market Bias

Bullish

 Preferred Scenario

Potential Continuation

 Primary Target Zone

5.00%

 Scenario Invalidation

Sustained close back below 3.75%

 Current Arc Level

In Transit Between Arcs

 Cycle Status

Mid-Cycle Migration Phase

 Arc Integrity

Neutral

Market outlook

Yields is progressing through the current Arc Cycle toward the next Arc boundary. If momentum continues, the preferred scenario is continued movement toward the Target price 5.00% .

Conversely, a sustained 1W close back below the 3.75% would invalidate the continuation scenario and could shift the outlook toward the Previous Arc Cycle.

Author

Mohamad Gharib

Mohamad Gharib

Independent Analyst

Mohamad Gharib is a Financial Markets Analyst and Quantitative Researcher with more than 18 years of experience in financial markets, including 15 years as an FX Quant Trader.


More from Mohamad Gharib
Share:

Editor's Picks

GBP/USD drops toward 1.3500 after weak UK jobs data

GBP/USD extends losses toward 1.3500 in European trading hours on Tuesday. The UK ILO Unemployment Rate held steady at 4.9% in the three months to June, against a forecast of 4.8%, while Employment Change arrived at 83K in the same period versus 147K previous. Weak UK labor data keep the British Pound under pressure, driving the pair lower.

EUR/USD flat lines below two-month high amid oil-driven inflation fears

The EUR/USD pair holds steady around the 1.1575-1.1580 region during the Asian session, and for now seems to have stalled the previous day's modest pullback from a two-month top. However, a modest US Dollar uptick warrants some caution before positioning for the resumption of the recent move higher from the 1.1350 area, or the July monthly swing low.

Gold remains depressed below $4,400 amid oil-driven inflation fears

Gold sticks to modest intraday losses below the $4,400 mark heading into the European session on Tuesday, and seems to have snapped a two-day winning streak. The US Dollar builds on the overnight bounce from a two-month trough as inflation risks stemming from higher oil prices underpin prospects for at least one interest rate hike by the US Federal Reserve in 2026.

Ripple and Stellar remain under bearish pressure as corrective declines cap upside

Ripple and Stellar remain under pressure as broader market uncertainty and weak technical momentum weigh on both altcoins. XRP is hovering below the key $1 mark on Tuesday while XLM continues its corrective decline below $0.157. Meanwhile, mixed derivatives and on-chain signals indicate cautious sentiment, leaving both cryptocurrencies vulnerable to further downside.

Silver’s new era: Supply deficits meet exploding industrial demand
Silver has experienced a wild ride in 2026, but The Silver Institute President and CEO Michael DiRienzo says investors shouldn’t let the volatility obscure a much bigger story: the underlying silver market remains remarkably strong.
Why is Crude Oil priced for a reopening the ships haven't made?
Fourteen vessels crossed the Strait of Hormuz on Tuesday. Before the war, the count ran near 120 a day. In the sessions since the waterway was publicly declared open, Brent has drifted back to $87 and West Texas Intermediate (WTI) to $81, both a little lower again on Wednesday, with daily momentum on each unwound from the top of its range in late July to the low twenties now.