US jobs disappoint; Gold climbs to fresh high

Gold surged to a fresh record on Friday after weaker-than-expected August non-farm payrolls boosted expectations of a September Fed rate cut. One ounce climbed to an intraday high of $3,600 at 17:30 GMT and was trading around $3,594.98 at 17:39 GMT. The metal had already peaked at $3,500 earlier this year amid US tariff-driven trade tensions and is up more than 30% year-to-date. After easing back to roughly $3,400 as trade fears subsided, renewed hopes of Fed easing reignited demand for the safe-haven asset.
August nonfarm payrolls disappointed—only 22,000 jobs added vs. 75,000 expected. June was revised down by 27,000 to a 13,000 loss, and unemployment ticked up to 4.3% from 4.2%.
Bullion and broader metals were set for a third straight weekly gain as the dollar softened on growing expectations of a September rate cut. Gold also drew safe‑haven flows earlier in the week amid concerns about stretched government debt in developed economies that pushed up sovereign yields, along with uncertainty over legal challenges to sweeping U.S. import tariffs.
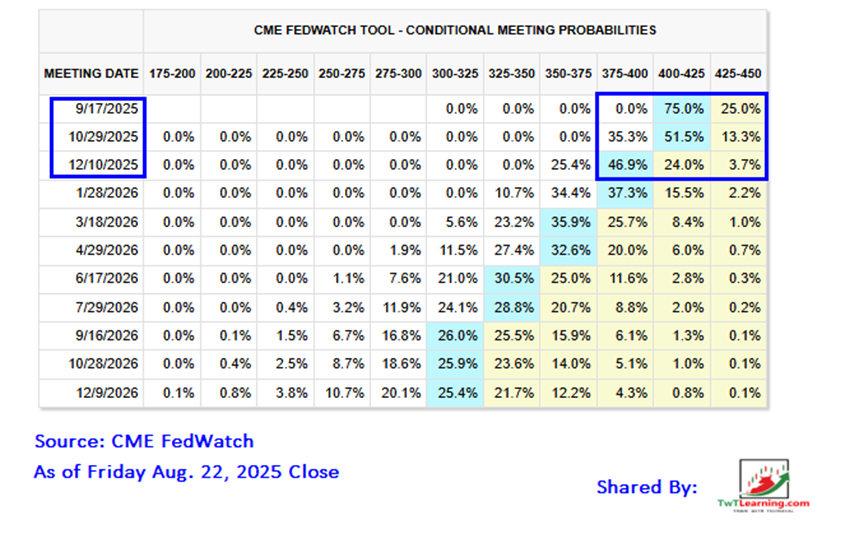
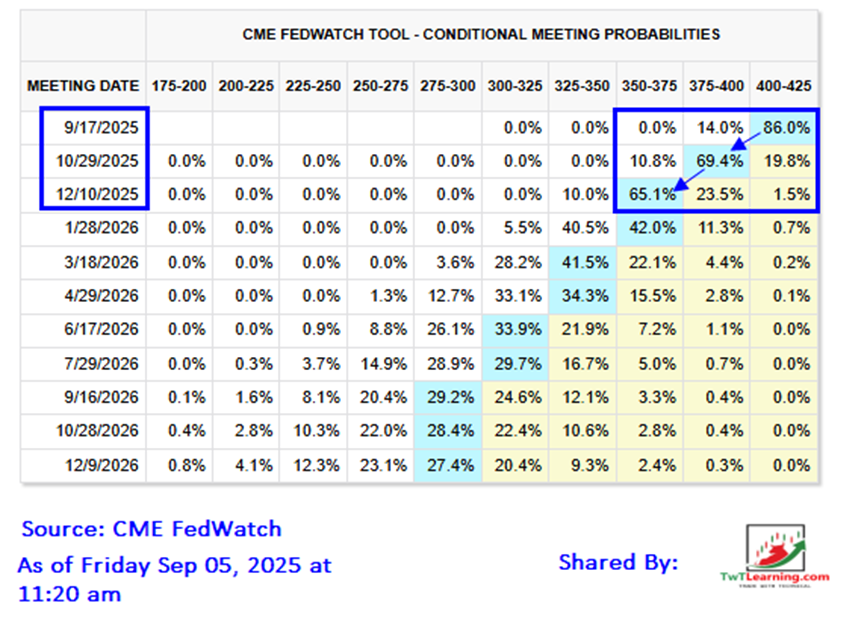
Fed cut count rises: Markets now expect three reductions
- What a shift in rate cut expectations from Aug 22, 2025, to today.
Technical analysis perspective:
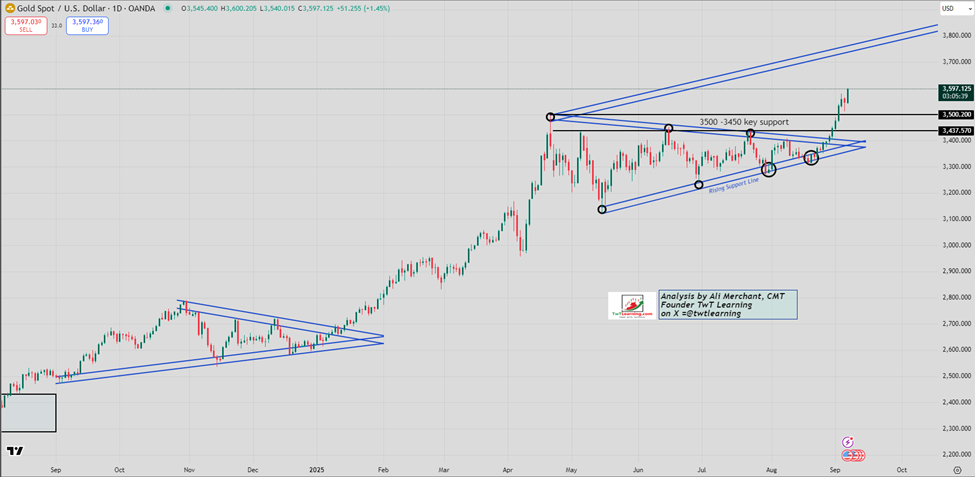
Gold / US Dollar:
- Gold often consolidates in triangle patterns before major rallies.
- It formed one from Sept ’24–Jan ’25 and rallied to $3,500 in April.
- A second triangle from April–Aug ’25 was breached last week, driving today’s record near $3,600.
- The breakout targets $3,750–$3,800, with $3,500 and $3,450 as the key support levels on any pullback.
Gold Daily chart:
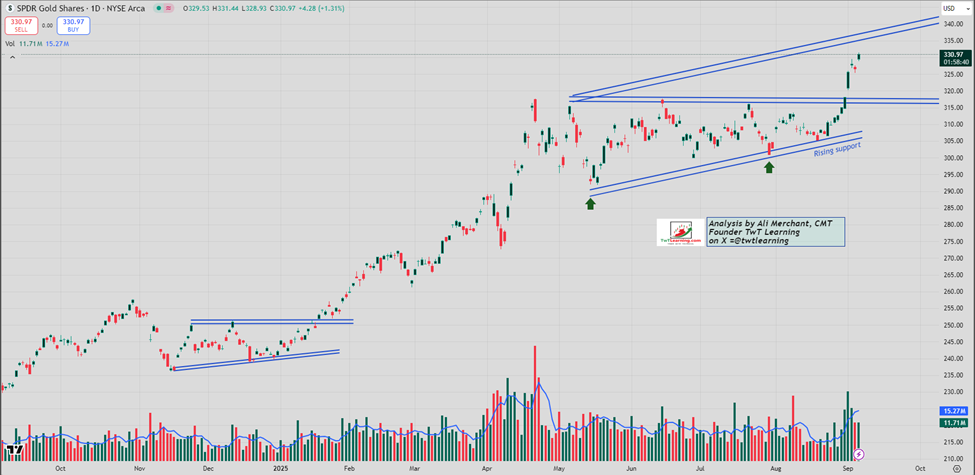
GLD (SPDR Gold Trust) ETF:
- GLD broke above critical resistance at 318 early this week following a triangular consolidation from April–August 2025.
- A comparable consolidation from November 2024 to January 2025 led to a rapid advance into the 317–318 zone.
- The current breakout projects a potential ascent to 335–340.
GLD daily chart:
GLD Seasonality:
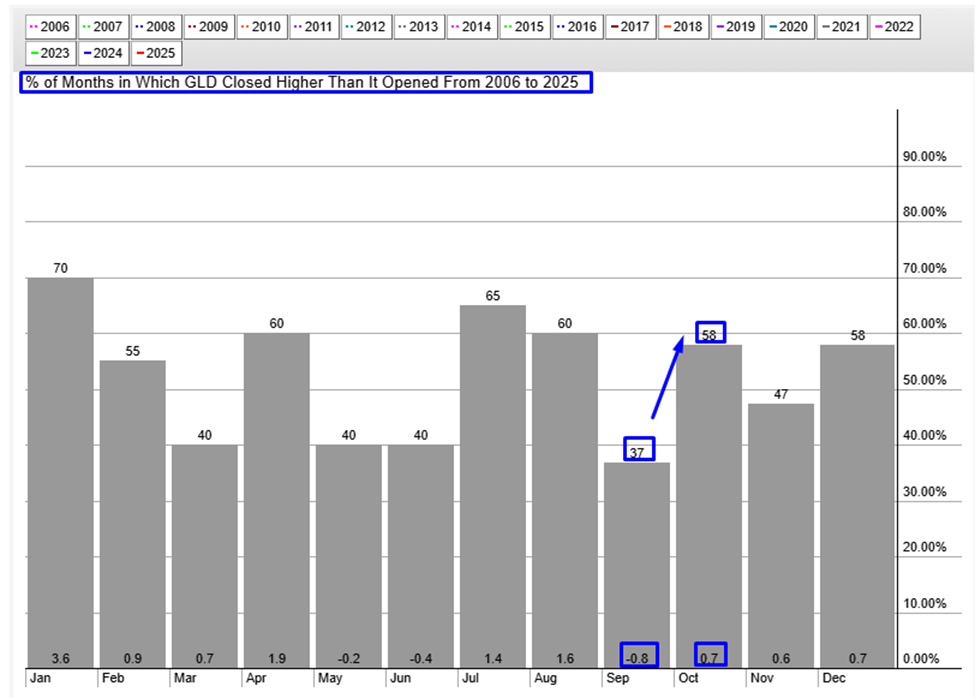
Since 2006, GLD has posted September decline of -0.8% in 37% of the years, while October has seen a rise of 0.70% in 58% of the years.
Author

Ali Merchant, CMT
TwT Learning
Ali Merchant is a seasoned financial market professional with expertise in Technical Analysis, Treasury & Capital Markets, Trading, Sales, Research, Training, & Fund Management, He has been trading FX, FX options, US stocks & opti


