US equity market hit by Fed’s hawkish stance

The U.S. dollar remains strong above the $105 mark following the Fed Chair's statement. U.S. long-term Treasury yields have surged, indicating sustained elevated interest rates into the next year.
The U.S. dollar remains steadfast above the $105 mark, while the domestic stock market experienced turbulence after the recent Fed Chair's statement. Investors grappled with the implications of the Fed's messaging, resulting in a bearish outlook for equities. U.S. long-term Treasury yields surged to levels last seen in 2007, signalling market expectations of sustained elevated interest rates into the next year. In addition, The U.S. Initial Jobless Claims data depicted a robust labour market, with claims reaching their lowest point since January. This data further bolsters the Fed's hawkish stance. Meanwhile, Japan's CPI index outperformed expectations, sustaining a level above the Bank of Japan's targeted rate for 17 consecutive months. Market watchers await the Bank of Japan's forthcoming monetary policy statement, set to be released today, to assess its impact on the Japanese yen's strength.
Market movements
Dollar index
The US Dollar, after hitting recent highs, retraced slightly as investors capitalised on recent gains. However, the long-term outlook for the greenback leans towards a bullish trajectory, buoyed by rising US Treasury yields and expectations of further monetary tightening by the Federal Reserve. Additionally, an unexpected 9% drop in initial jobless claims, marking an eight-month low, signalled resilience in the US employment sector, further bolstering the US Dollar's standing.
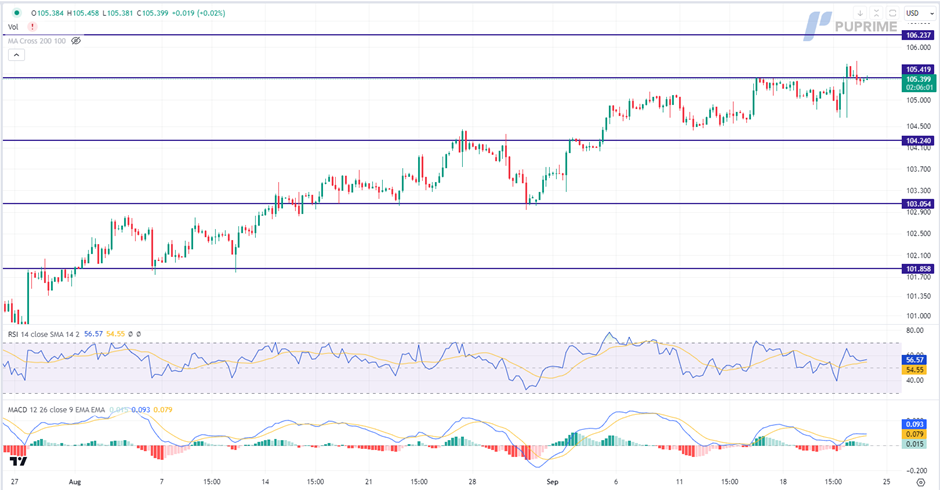
The Dollar Index is trading flat while currently testing the resistance level. MACD has illustrated diminishing bullish momentum, while RSI is at 57, suggesting the index might experience technical correction since the RSI retreated sharply from overbought territory.
Resistance level: 105.40, 106.25.
Support level: 104.25, 103.05.
XAU/USD
The gold market extended its losses after breaching a critical support level, driven lower by a stronger US Dollar and robust US jobs data. These factors have continued to fuel the ongoing sell-off in gold prices, dimming its safe-haven appeal.
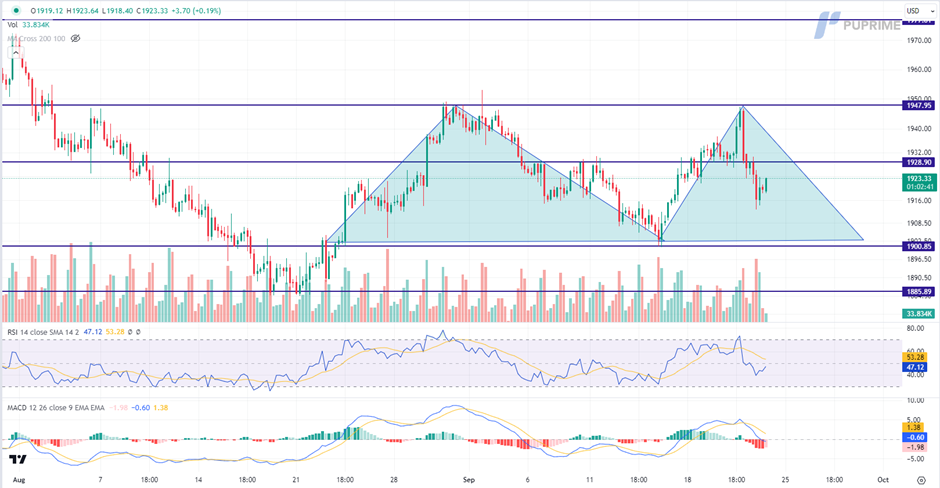
Gold prices are trading lower following the prior breakout below the previous support level. MACD has illustrated increasing bearish momentum, while RSI is at 47, suggesting the commodity might extend its losses toward support level.
Resistance level: 1930.00, 1950.00.
Support level: 1900.00, 1885.00.
EUR/USD
The euro remains under pressure from the resurgent dollar, teetering on the edge of breaching its nearby support level at 1.0638. Following Wednesday's FOMC statement, U.S. Treasury yields soared to their loftiest point since 2007. This surge reflects the market's anticipation of the Federal Reserve maintaining interest rates at a restrictive level well into the forthcoming year. Additionally, the recent release of Initial Jobless Claims data underscores the robustness of the U.S. labour market, providing further impetus for the dollar's strength.
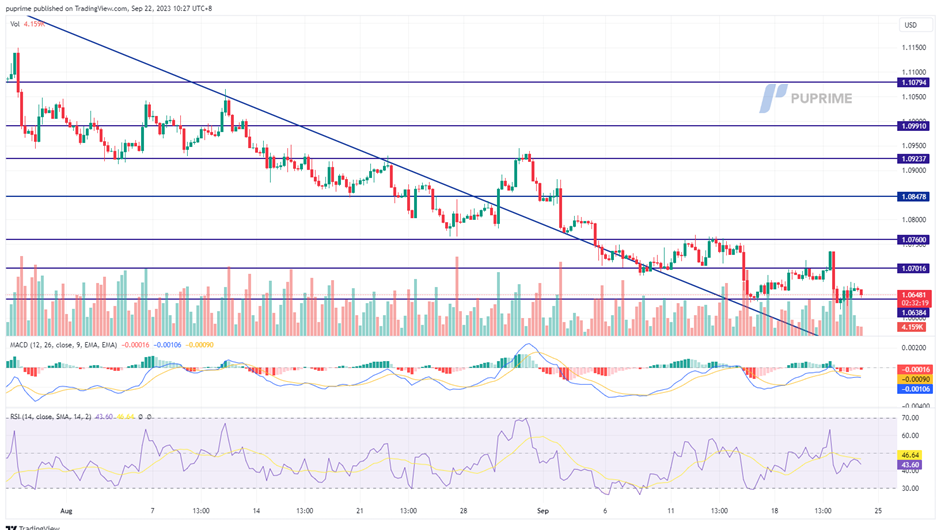
EUR/USD is struggling to stay above its near support level at 1.0638; a break below will serve as a solid bearish signal for the pair. The MACD has been flowing below the zero line while the RSI hovers near the 50-level, suggesting a neutral-bearish signal for the pair.
Resistance level:1.0700, 1.0760.
Support level: 1.0640, 1.0540.
GBP/USD
GBP/USD continues its slide following the Bank of England's unexpected decision to keep interest rates unchanged, marking the end of a 14-successive-hike streak since December 2021. The central bank's key rate remains at 5.25%, with a split vote of five members of the Monetary Policy Committee favouring no change and four advocating for a rate increase to 5.50%. This decision follows mounting indications that the UK economy is teetering on the edge of a recession.
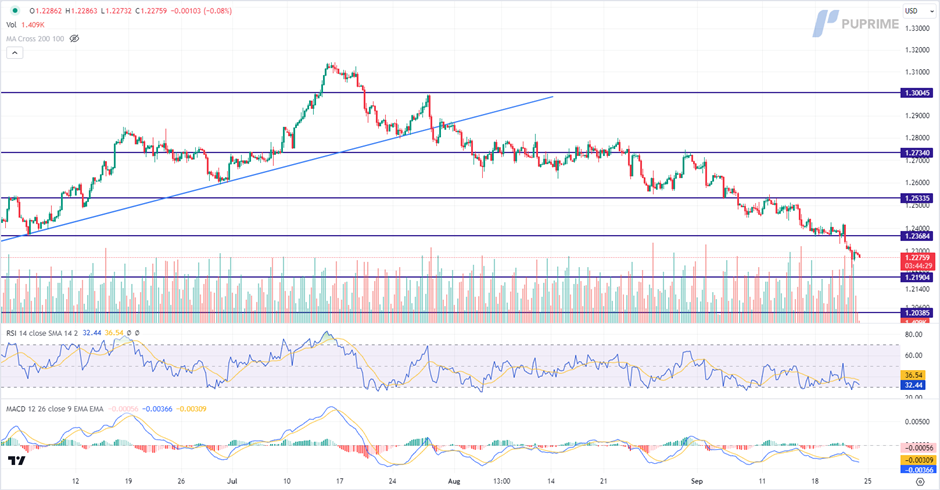
GBP/USD is trading lower following the prior breakout below the previous support level. However, MACD has illustrated diminishing bearish momentum, while RSI is at 32, suggesting the pair might extend its losses toward support level.
Resistance level: 1.2370, 1.2535.
Support level: 1.2190, 1.2040.
NZD/USD
The New Zealand dollar initially faltered in the face of the strong U.S. dollar following a hawkish statement by the Fed Chair on Wednesday. However, the Kiwi recovered after upbeat economic data emerged from New Zealand. Favourable figures from the New Zealand trade balance and the country's GDP provided support for the Kiwi, allowing it to withstand the pressures of the robust USD. Furthermore, the upward trajectory of short-term bond yields in New Zealand suggests the Kiwi may continue to appreciate.
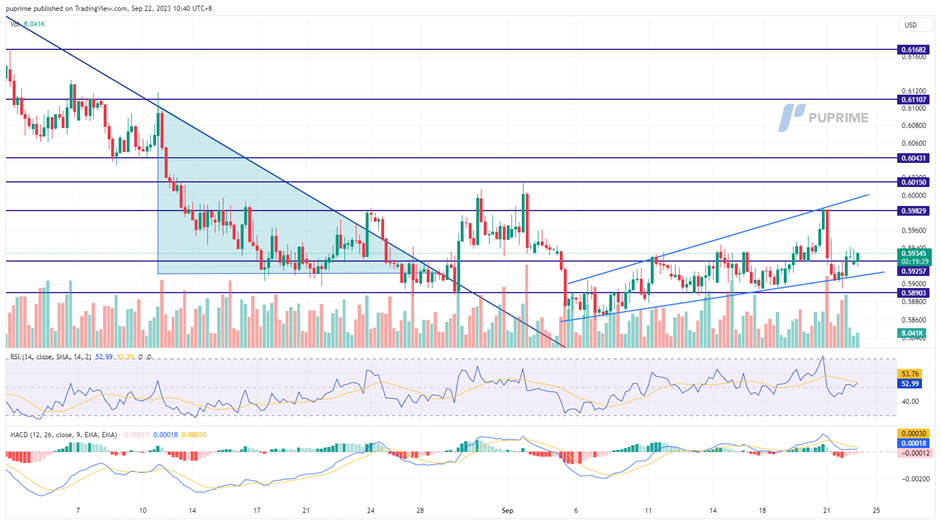
The Kiwi has an expanding triangle pattern and has rebounded at the support level at 0.5900. The RSI has been flowing at the upper region and the MACD has stayed above the zero line, suggesting the bullish momentum is forming.
Resistance level: 0.5985, 0.6015.
Support level: 0.5890, 0.5800.
Nasdaq
The US equity market endured a significant sell-off as investor sentiment grappled with apprehensions that the Federal Reserve's cautious monetary policy stance might persist longer than previously anticipated. This downturn was particularly pronounced among interest rate-sensitive mega cap stocks, exemplified by Amazon.com (NASDAQ: AMZN), Nvidia Corp (NASDAQ: NVDA), Apple Inc (NASDAQ: AAPL), and Alphabet (NASDAQ: GOOGL) Inc, dragging the S&P 500 and the Nasdaq to their lowest closing levels since June.
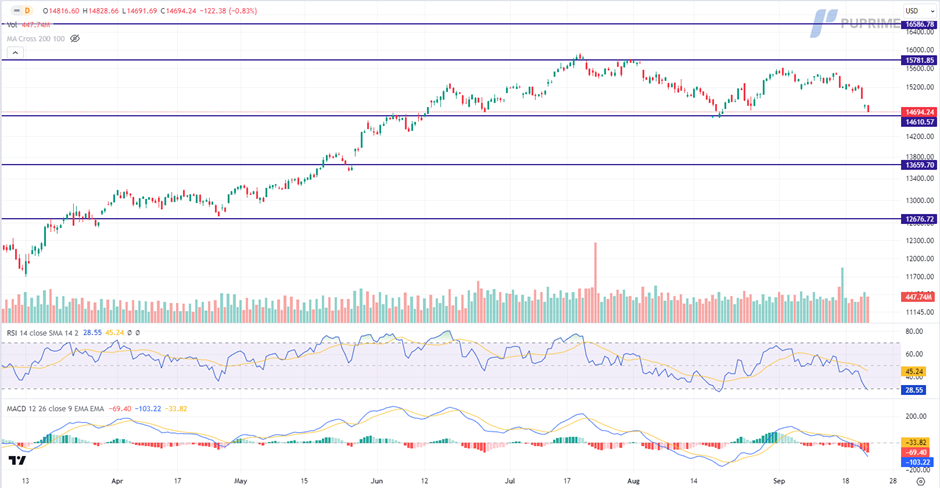
Nasdaq is trading lower while currently testing the support level. MACD has illustrated increasing bearish momentum. However, RSI is at 29, suggesting the index might enter oversold territory.
Resistance level: 15780.00, 16585.00.
Support level: 14610.00, 13660.00.
USD/JPY
The Japanese yen mounted a sharp rebound in anticipation of the Bank of Japan's monetary policy decisions, with market participants expecting a potential hawkish tone due to recent inflationary pressures. While economists anticipate that the Bank of Japan will maintain its existing policy, potential adjustments to its ultra-loose monetary settings in response to rising bond yields and inflationary trends are under scrutiny. Investors eagerly await Governor Kazuo Ueda's briefing for insights into the bank's timeline for phasing out its massive quantitative easing program.
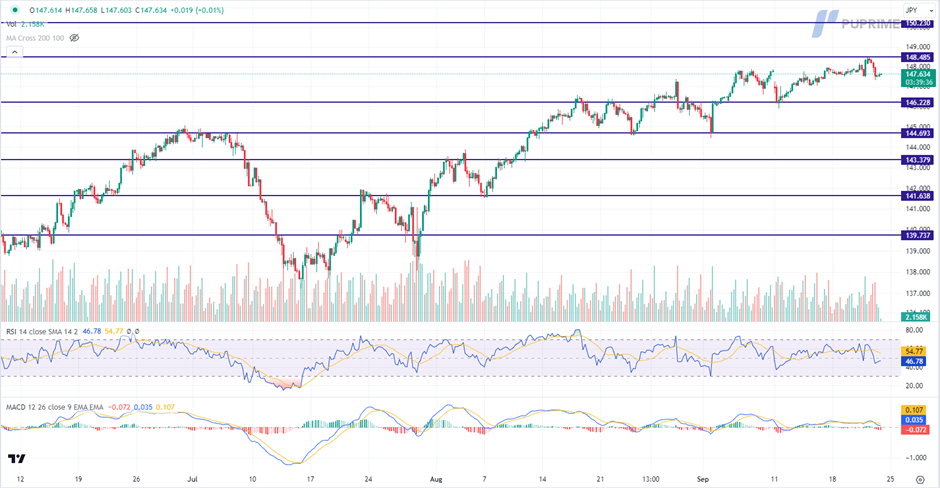
USD/JPY is trading lower following the prior retracement from the resistance level. MACD has illustrated increasing bearish momentum, while RSI is at 47, suggesting the pair to extend its losses toward support level since the RSI stays below the midline.
Resistance level: 148.50, 150.25.
Support level: 146.25, 144.70.
CL Oil
Oil prices staged a notable recovery after Russia announced an immediate temporary ban on gasoline and diesel exports to all countries outside a select group of four ex-Soviet states. This move aims to stabilise the domestic market. However, these gains remain constrained by the lingering impact of the Federal Reserve's hawkish statements, projecting a quarter-percentage-point interest rate increase to a range of 5.50% to 5.75% by year-end. Market watchers are closely tracking the energy sector for further developments amid these shifting dynamics.
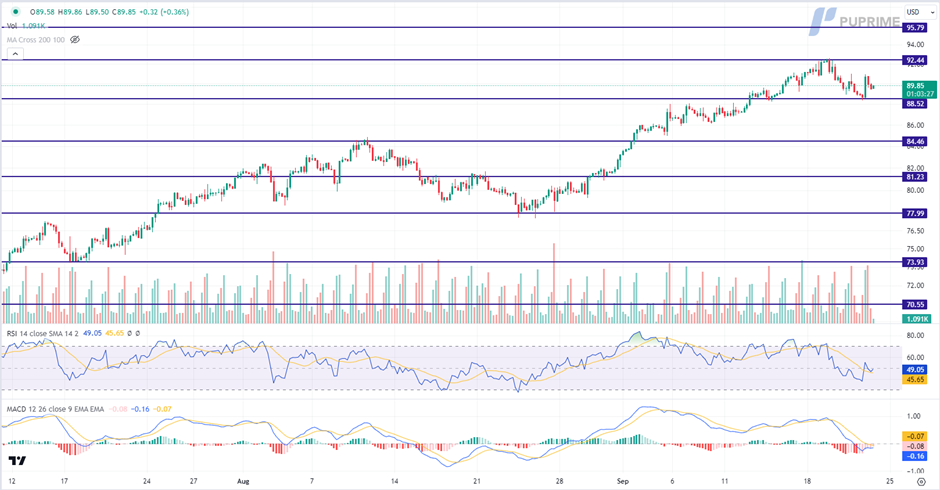
Oil prices are trading lower while currently near the support level. MACD has illustrated diminishing bearish momentum. However, RSI is at 49, suggesting the commodity might extend its losses after breakout since the RSI stays below the midline.
Resistance level: 92.45, 95.80.
Support level: 88.50, 84.45.
Author

PU Prime team
PU Prime
PU Prime is an award-winning CFD broker offering clients access to multiple products across multiple asset classes. Traders will have access to FX, Commodities, Indices, Share CFDs and Bonds.


