US equities reach new record high levels

USD slips in the FX market
The USD slipped in the FX market yesterday, signalling a possible stabilisation ahead the release of July’s US employment report on Friday. Today we get the US ISM non-manufacturing PMI figure for July, and a possible wider-than-expected rise of the indicator’s reading could provide some support for the USD. Meanwhile, north of the US border, the drop of oil prices tends to weigh on the Loonie, while in the Far East JPY seems to be stabilising after the joint US-Japanese market intervention operation to strengthen the Yen.
Dow Jones, S&P 500 reach new all-time highs
In what may have been the most impressive move of the markets yesterday, US equities rallied and its characteristic that Dow Jones and S&P 500 reached new record high levels, While Nasdaq also rallied. The market’s optimism was allowed to support equities as market worries for a possible overspending on AI technology eased. As for earnings reports, today we note Berkshire Hathaway and Disney.
Oil prices drop on hopes for a reopening of the Straits of Hormuz
Oil prices dropped yesterday as market hopes for a possible diplomatic resolution of the US-Iran impasse were enhanced. Qatari mediators reported progress and Axios even mentioned that Oman, the US and Iran are nearing a 60-day accord to reactivate the Straits of Hormuz waterway. Yet Iran still stated that no negotiations are taking place as noted in yesterday’s report, hardening its stance on the management of shipping traffic in the waterway. Should market hopes intensify we may see oil prices retreating further.
Gold’s price edges higher
Gold’s price edged higher in today’s Asian session taking advantage of the weakening of the USD in the FX market yesterday. The movement despite being somewhat disproportionate, signals that the negative correlation of the USD with gold’s price is active. Also, the decline of oil prices tended to sooth market worries for inflationary pressures in the US economy, thus allowing gold’s price to rise.
Other highlights for today
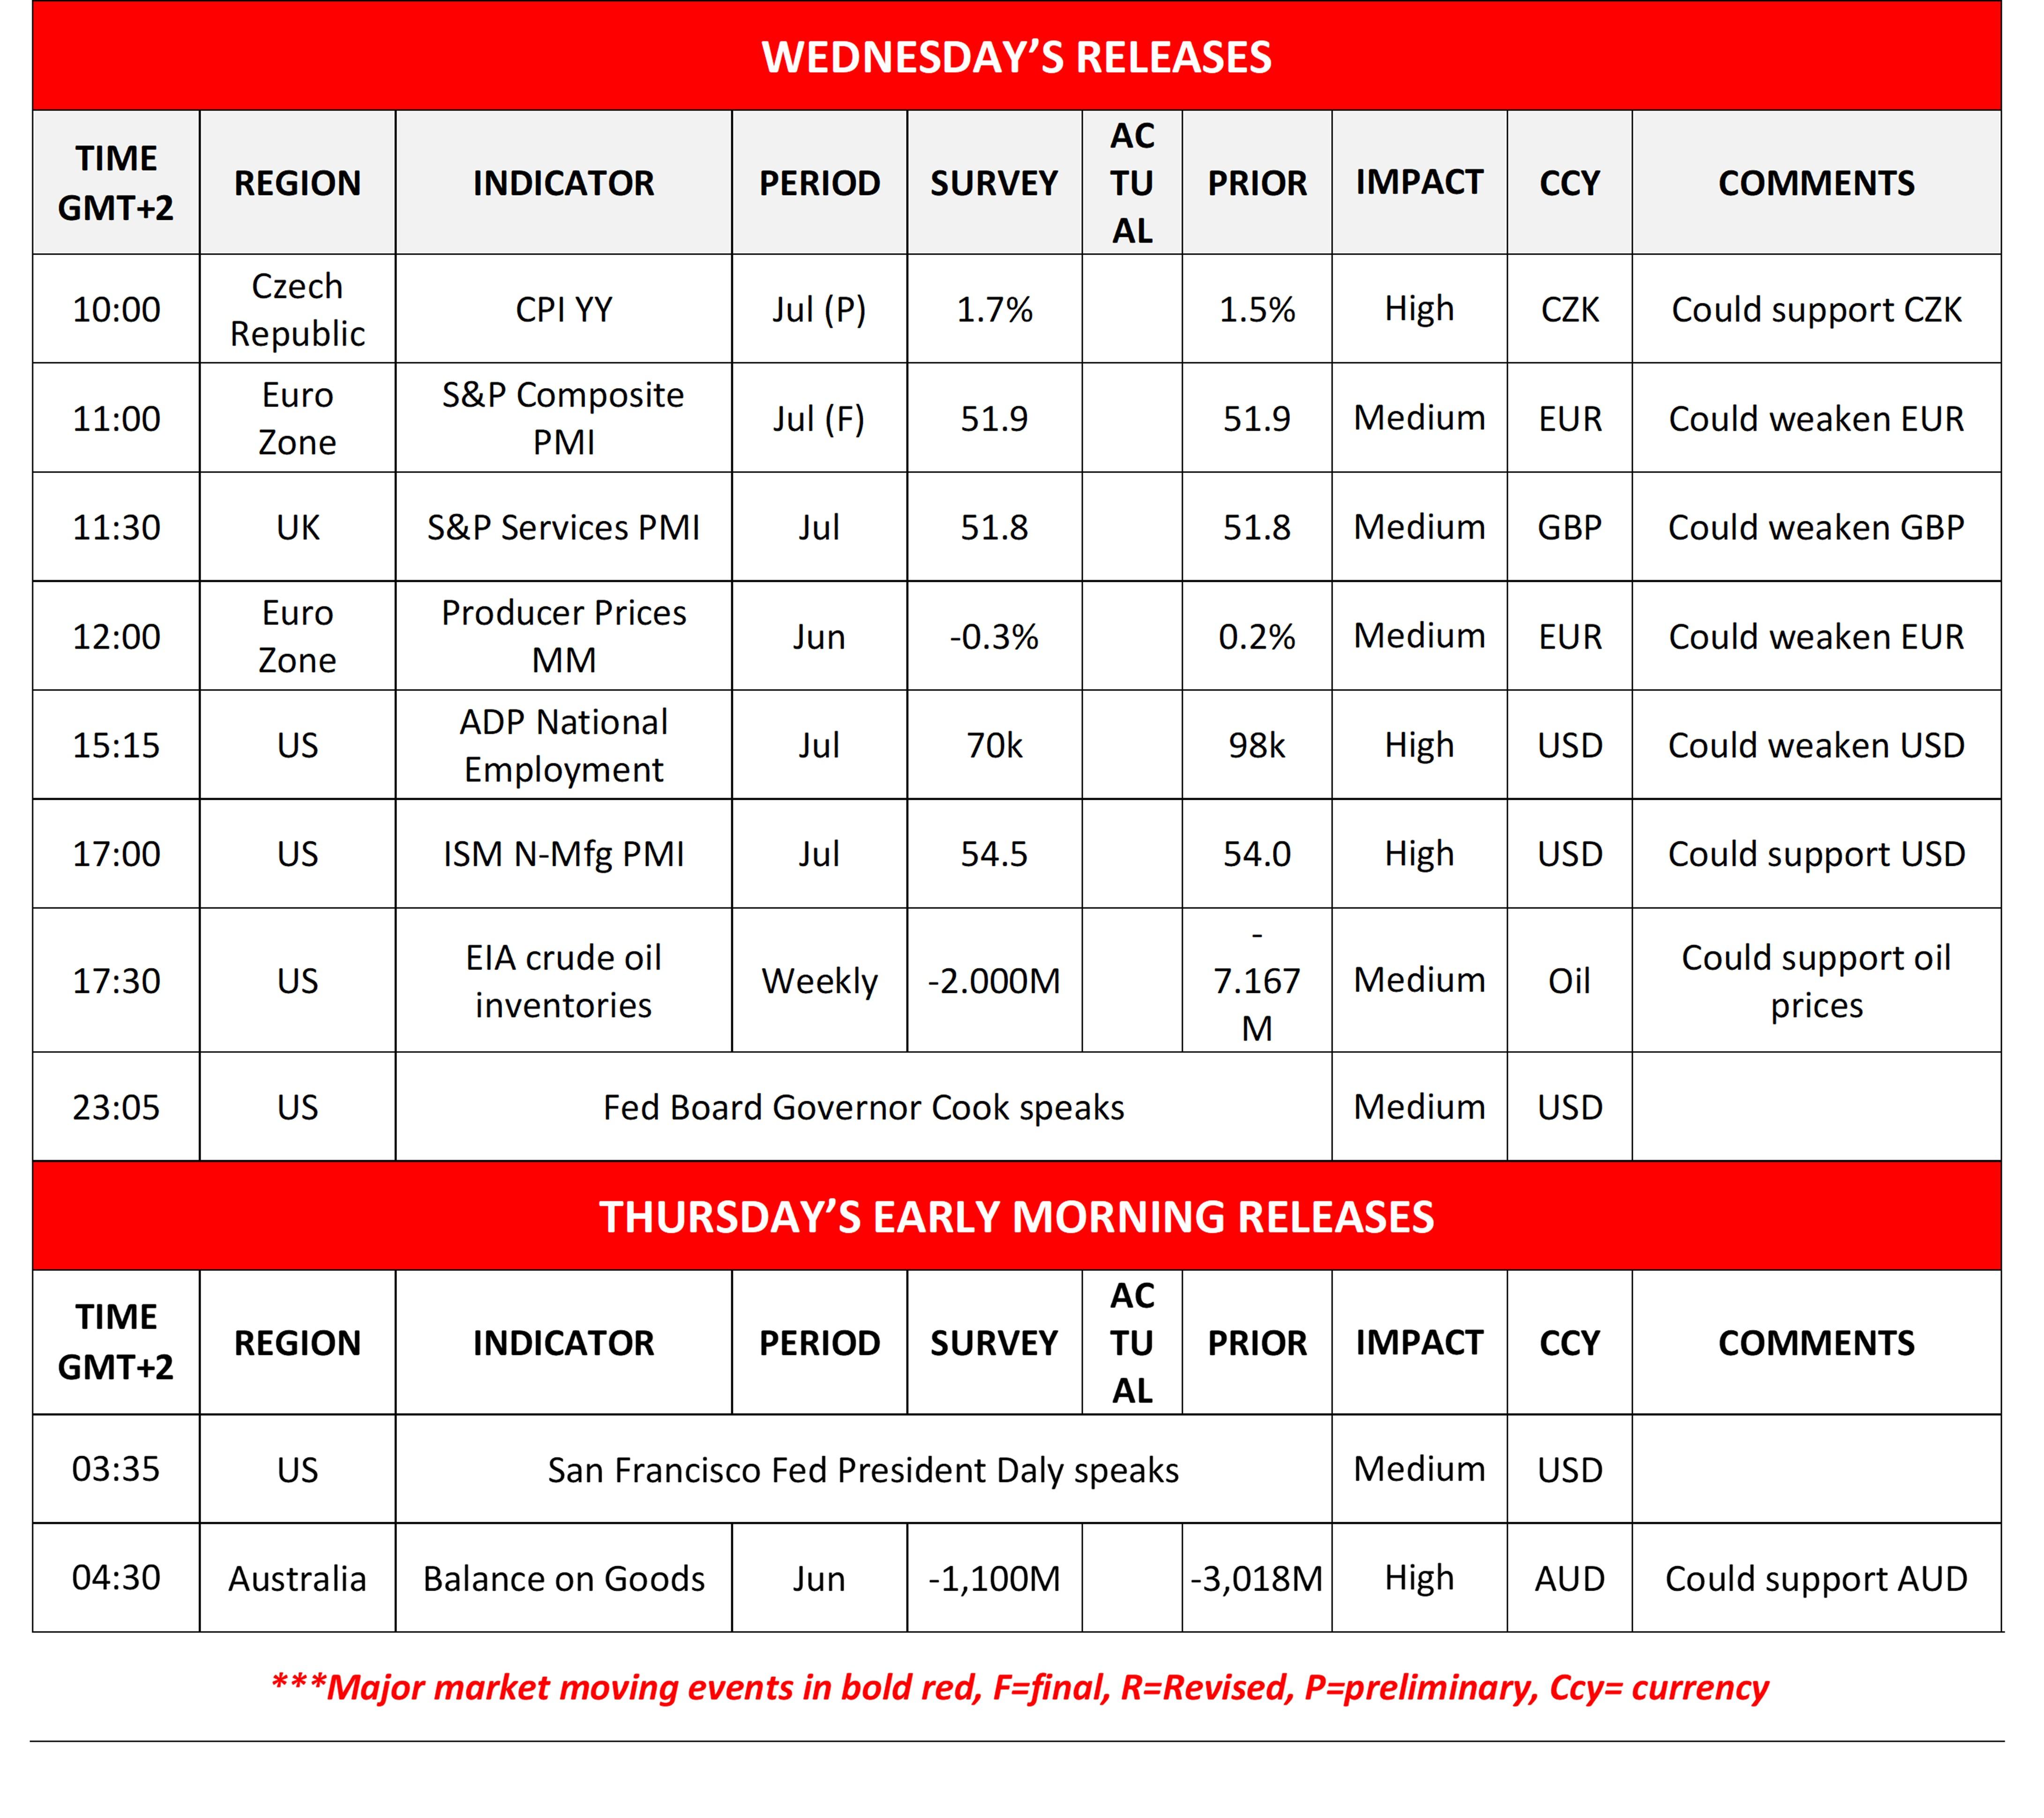
Today we get July’s Czech CPI rate, Euro Zone’s and the UK’s final S&P composite and services PMI figures for July, Euro Zone’s PPI for June, the US ADP employment figure for July and the weekly EIA oil inventories figure, while Fed Board Governor Cook speaks. In tomorrow’s Asian session, we get Australia’s trade data for June while San Francisco Fed President Daly speaks.
Charts to keep an eye out
S&P 500 rallied yesterday breaking consecutively the 7620 (S2) and 7750 (S1) resistance lines, both now turned to support. The upward movement was accompanied by an enhancement of the bullish market sentiment, given the rise of the RSI indicator, which allows us to adopt a bullish outlook for the index. Should the bulls maintain control as expected we may see the index aiming if not breaking the 7875 (R1) resistance level and set as the next possible target for the bulls the 8000 (R2) resistance line. Yet the index’s price action, has surpassed the upper Bollinger band, which may cause a correction lower for S&P 500. Should the bears to take over, we may see S&P500 breaking the 7750 (S1) support line and continue to break also the 0.7620 (S2) support level and start actively aiming for the 7490 (S3) support hurdle.
WTI’s dropped breaking the 76.00 (R1) support line, now turned to support. The RSI indicator rolled down along with the commodity’s price action, breaking below the reading of 50, implying an enhancement of the bearish market sentiment for WTI’s price. We maintain a bearish outlook on a technical level for WTI and should the bears maintain the initiative, WTI’s price may break the 71.85 (S1) support line and aim for the 67.05 (S2) support level. Should the bulls take over, which we consider currently as a remote scenario, WTI may break the 76.00 (R1) resistance line opening the way for the 82.00 (R2) resistance zone.
Calendar follows
US 500 Cash daily chart
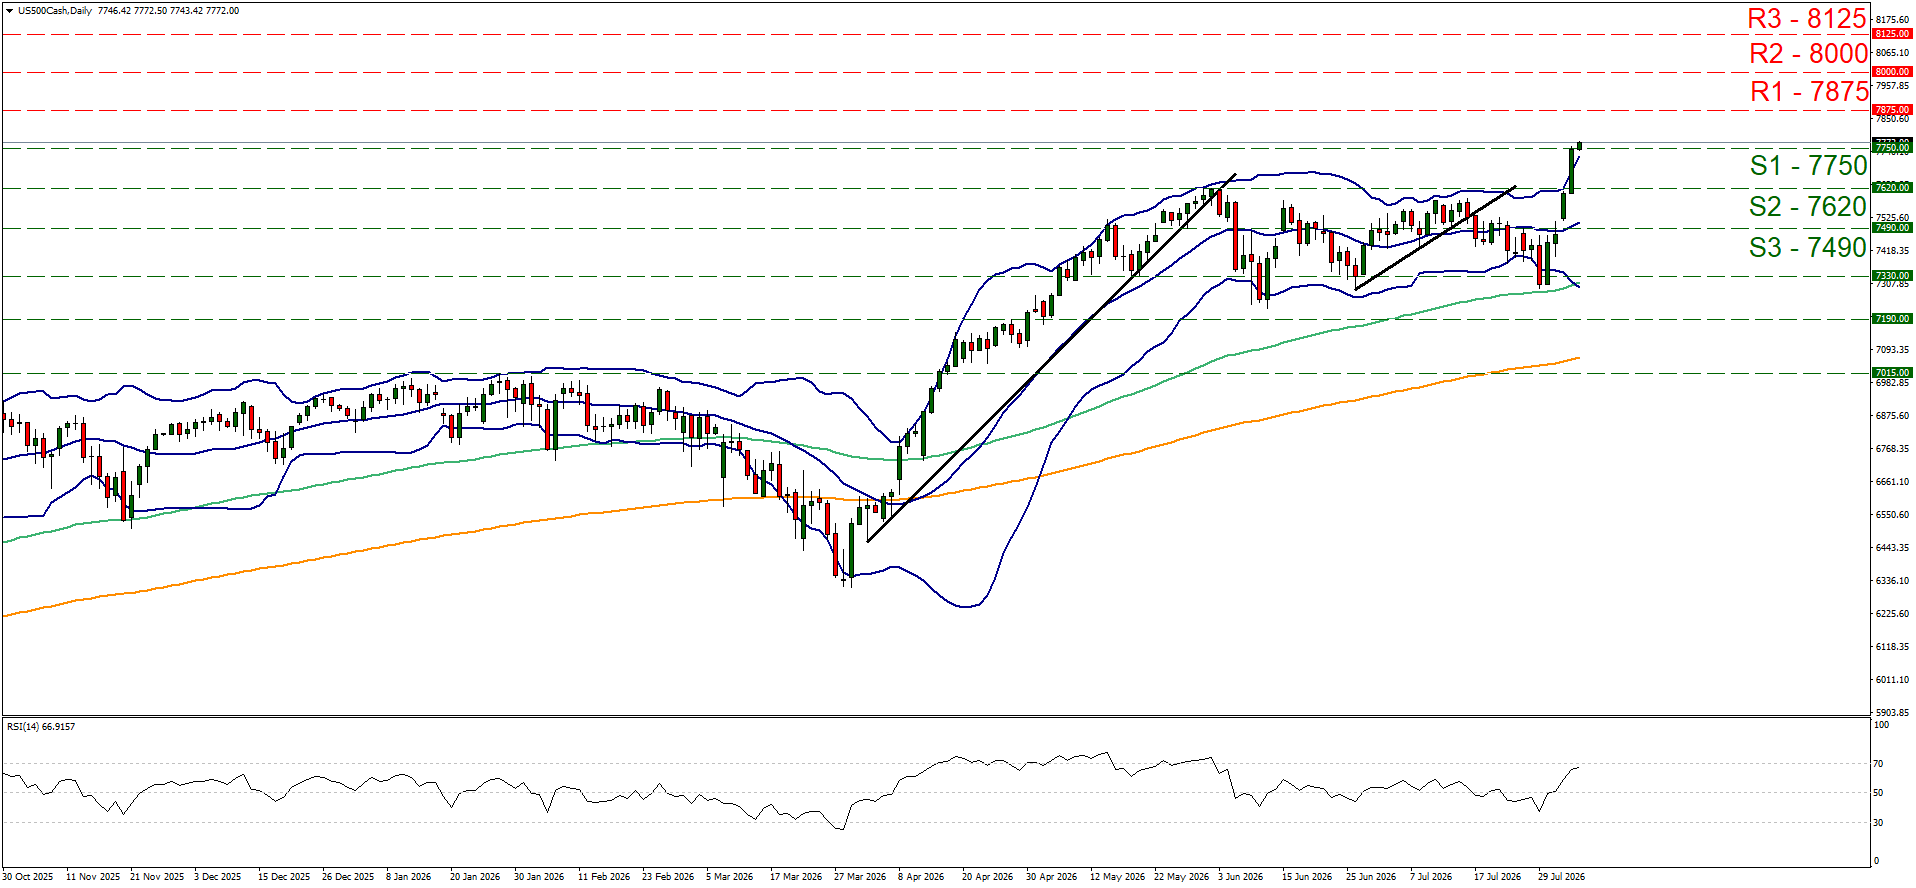
- Support: 7750 (S1), 7620 (S2), 7490 (S3).
- Resistance: 7875 (R1), 8000 (R2), 8125 (R3).
WTI daily chart
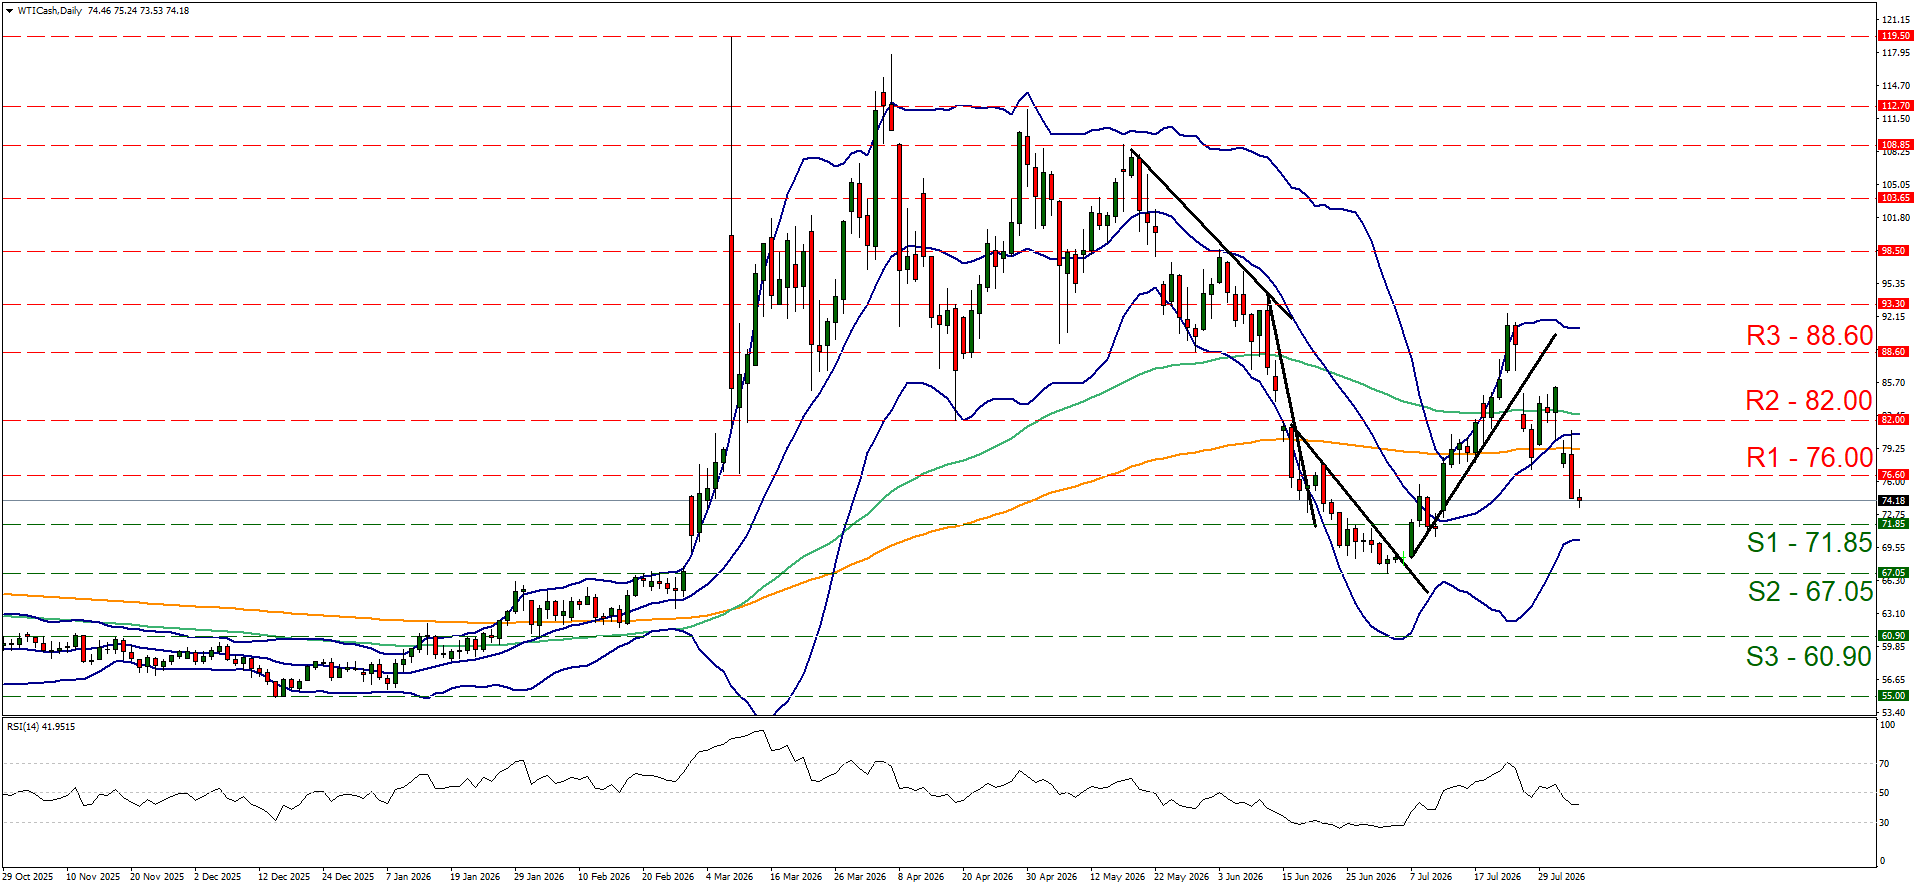
- Support: 71.85 (S1), 67.05 (S2), 60.90 (S3).
- Resistance: 76.00 (R1), 82.00 (R2), 88.60 (R3).
Author

Peter Iosif, ACA, MBA
IronFX
Mr. Iosif joined IronFX in 2017 as part of the sales force. His high level of competence and expertise enabled him to climb up the company ladder quickly and move to the IronFX Strategy team as a Research Analyst. Mr.