Uncertainty Following the Rebound, New Uptrend or Just Correction?
Stocks went sideways on Wednesday, as investors hesitated following the recent volatile fluctuations. The S&P 500 index retraced some of its last week's sell-off on Tuesday, following bouncing off the long-term upward trend line. Is this a new uptrend or just upward correction before another leg down?
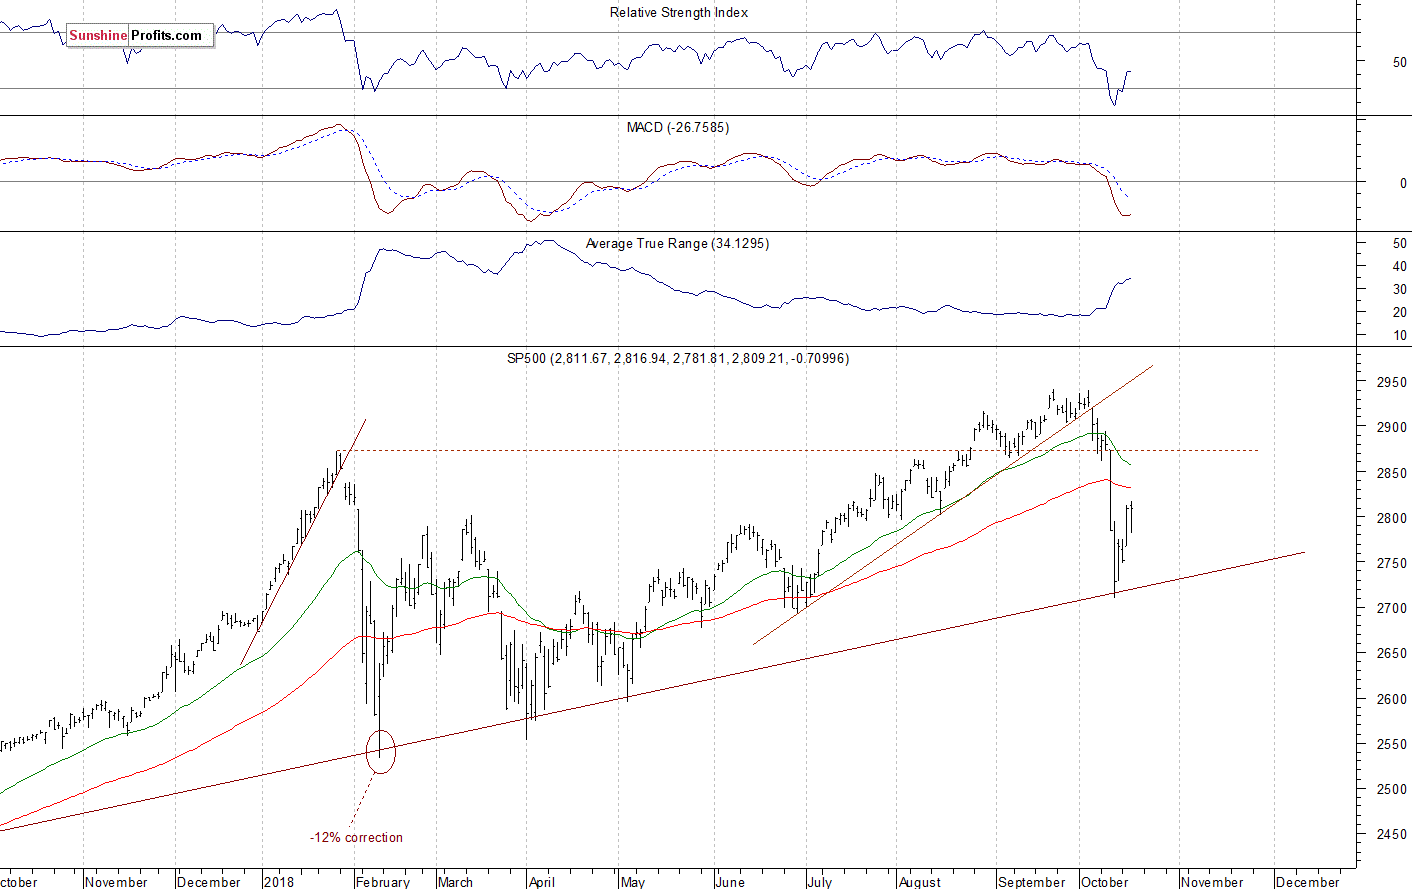
The U.S. stock market indexes were mixed between -0.4% and 0.0% on Wednesday, as investors hesitated following the recent rebound off the support level. The S&P 500 index bounced off its long-term upward trend line on Thursday. It is currently 4.5% below September the 21st record high of 2,940.91. The Dow Jones Industrial Average lost 0.4% and the Nasdaq Composite was unchanged on Wednesday.
The nearest important level of resistance of the S&P 500 index remains at around 2,825-2,830, marked by August the 16th daily gap up of 2,827.95-2,831.44. The next resistance level is at 2,850-2,860. On the other hand, the nearest important level of support is at 2,795-2,800, marked by last Thursday's daily high. The support level is also at 2,775-2,785, marked by some recent fluctuations.
The broad stock market continued retracing its medium-term advance last week, as it got closer to 2,700 mark. Then it bounced on Friday, retracing some of the decline. On Tuesday, the index broke above the resistance level of around 2,800. Yesterday we saw a short-term consolidation. Will it continue higher? For now, it looks like an upward correction following the recent sell-off:
Consolidation Along 2,800 Mark
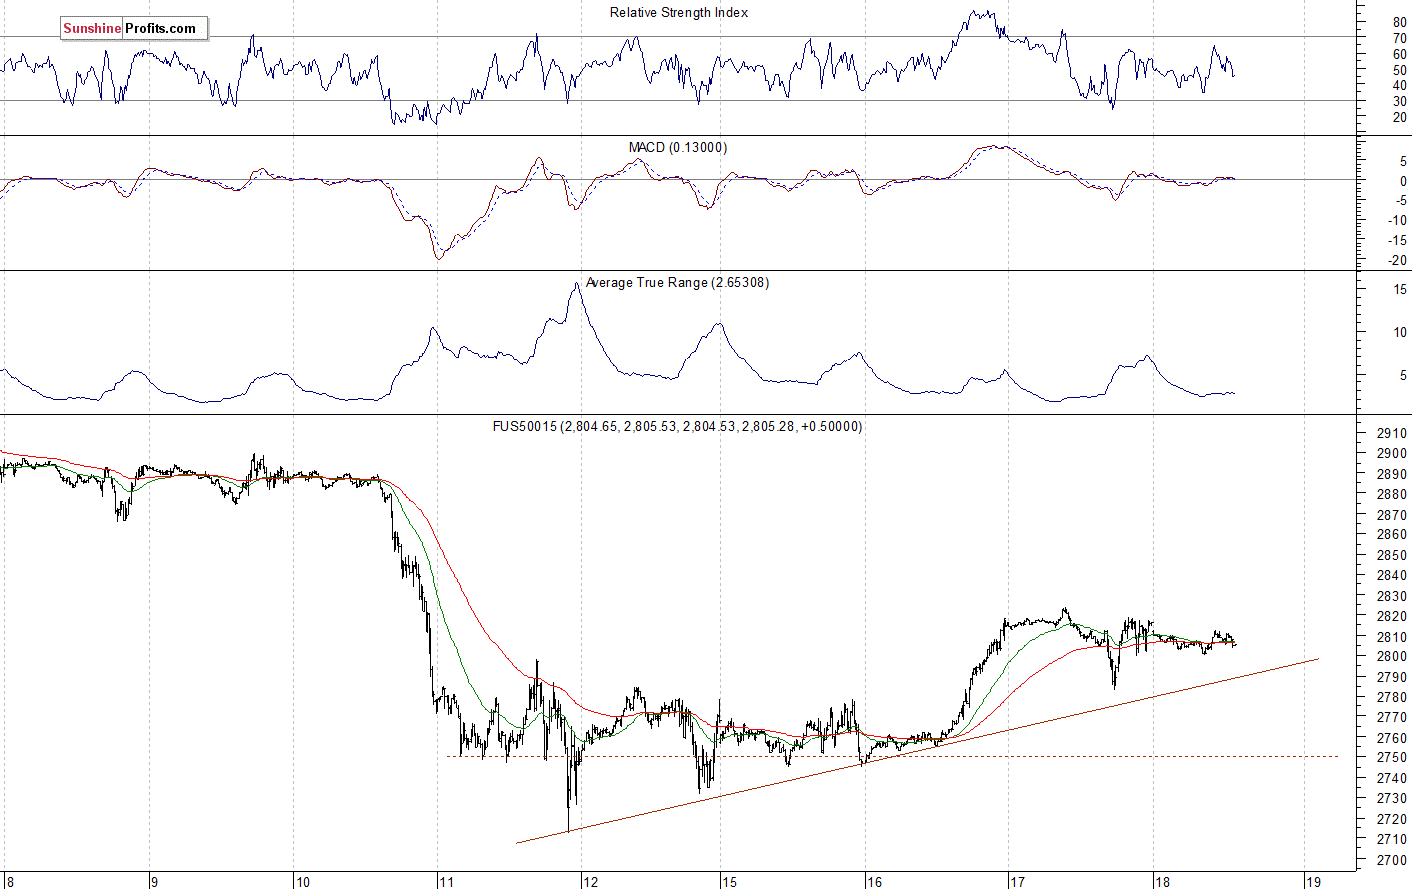
Expectations before the opening of today's trading session are negative, as the index futures contract trade 0.3-0.5% below their yesterday's closing prices. The European stock market indexes have been mixed so far. Investors will wait for some economic data announcements today: Philadelphia Fed Manufacturing Index, Initial Claims at 8:30 a.m. The broad stock market will likely extend its short-term fluctuations today. For now, it looks like an upward correction following last week's sell-off. So will the market continue retracing that sell-off? If the S&P 500 index remains above 2,800, we could see more buying pressure at some point.
The S&P 500 futures contract trades within an intraday consolidation, as it continues to trade along the level of 2,800. The nearest important resistance level is at around 2,815-2,820, marked by the local high. On the other hand, the support level remains at 2,785-2,800. The futures contract trades slightly above the level of 2,800, as the 15-minute chart shows:
Nasdaq Going Sideways
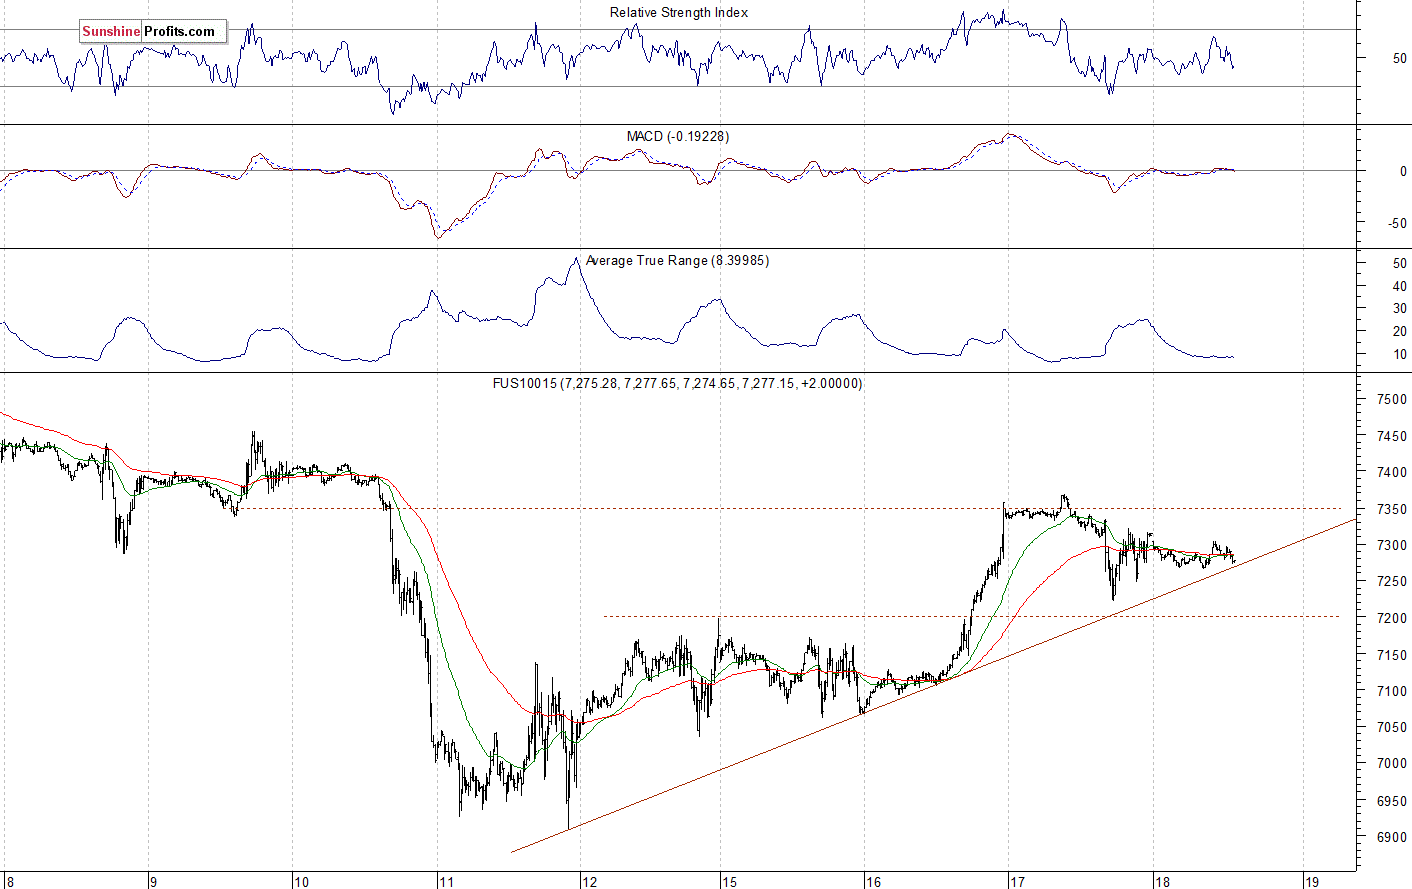
The technology Nasdaq 100 futures contract follows a similar path, as it continues to fluctuate after its Tuesday's rally. The tech stocks' gauge broke below 7,000 mark recently, and it traded closer to the level of 6,900 on Thursday. So it fell over 800 points off its October the 1st record high above the level of 7,700. On Tuesday it bounced back above 7,300 mark. We could see more short-term volatility. The nearest important level of resistance is at around 7,300-7,350. On the other hand, the support level is at 7,200-7,250, among others. The Nasdaq futures contract trades close to its short-term upward trend line, as we can see on the 15-minute chart:
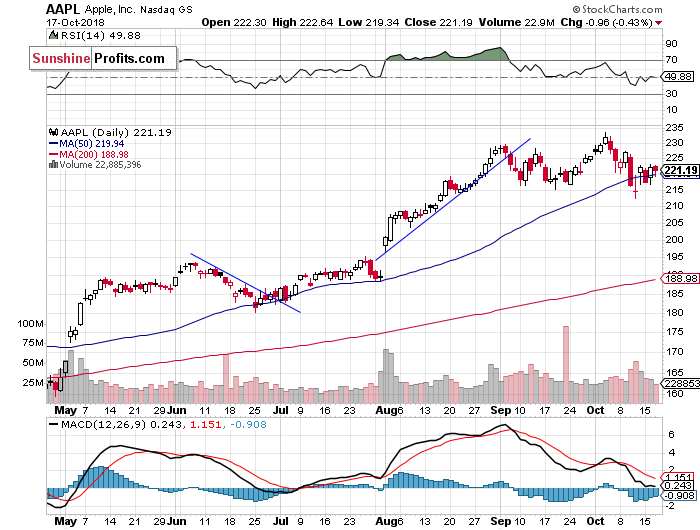
Apple, Amazon - Will The Big Cap Tech Stocks Continue Higher?
Let's take a look at Apple, Inc. stock (AAPL) daily chart (chart courtesy of http://stockcharts.com). It reached the new record high at the level of $233.47 in the early October, as it continued to act relatively strong. Then the stock retraced its rally. Apple trades within an almost two-month-long consolidation, and the support level remains at around $215:
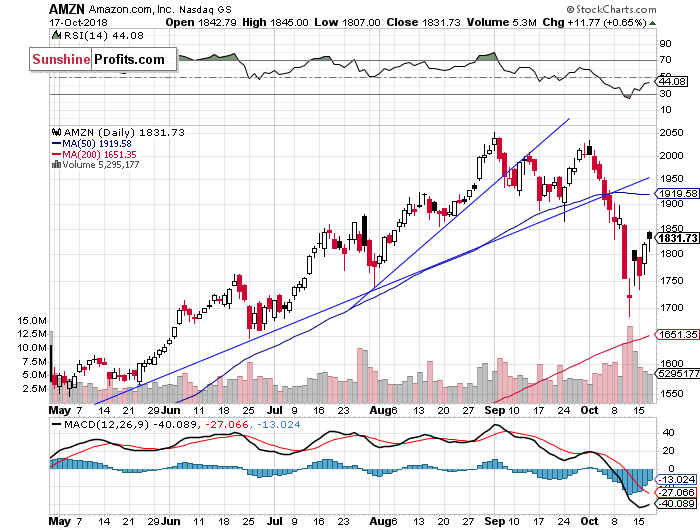
Now let's take a look at Amazon.com, Inc. stock (AMZN) daily chart. It traded within a clear short-term downtrend following breaking down below its upward trend lines. The downtrend accelerated on Wednesday, and the stock continued lower on Thursday a week ago. On Friday we wrote that "we can see an attempt at bouncing off the support level of around $1,700" And the stock did bounce off the support level. For now, it looks like an upward correction:
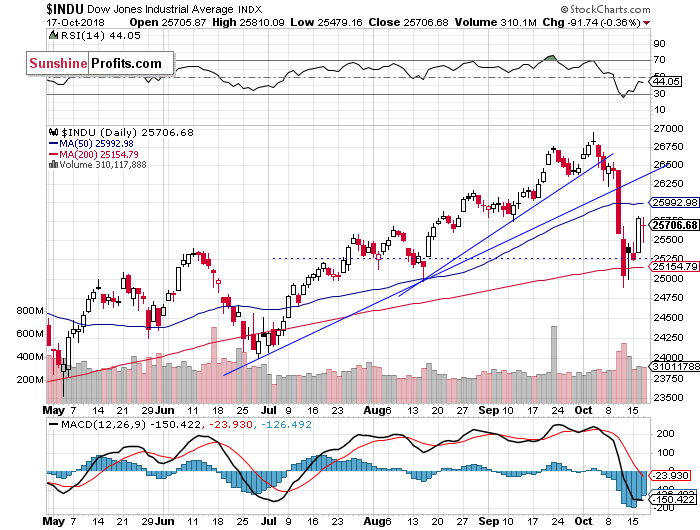
Dow Jones Still Below 26,000 Mark
The Dow Jones Industrial Average reached its new all-time high at the level of 26,951.81 on October the 3rd. Then the blue-chip stocks' gauge broke below its medium-term upward trend lines and the support level of around 26,000. And then it accelerated lower. On Friday the market bounced off the support level of around 25,000. The index continued upwards on Tuesday, but it remains below 26,000 mark:
The S&P 500 index sold off last week, following breaking down below its early September local lows. The market sharply reversed its medium-term uptrend. Then it fell closer to 2,700 mark on Thursday. Since then it is retracing some of the decline. On Tuesday we saw a rally and a breakout above the level of 2,800. But will the broad stock market continue higher? For now, it looks like an upward correction.
Concluding, the S&P 500 index will probably open lower today. The market trades within an upward correction following the recent sell-off. We may see more short-term volatility ahead.
Want free follow-ups to the above article and details not available to 99%+ investors? Sign up to our free newsletter today!
Author

Paul Rejczak
Sunshine Profits
Paul Rejczak is a stock market strategist who has been known for the quality of his technical and fundamental analysis since the late nineties.


