Tying the signals in miners, Silver and USDX to what comes next

The precious metals sector was likely to decline, and it did exactly that. And based on what we just saw, it's likely to decline even more.
Once again, the situation yesterday and so far today developed quite in tune with what we wrote yesterday, so today's analysis will take form of a broad update. Let's take a look at the GLD ETF. In yesterday's and Monday's analyses, we described it in the following way:
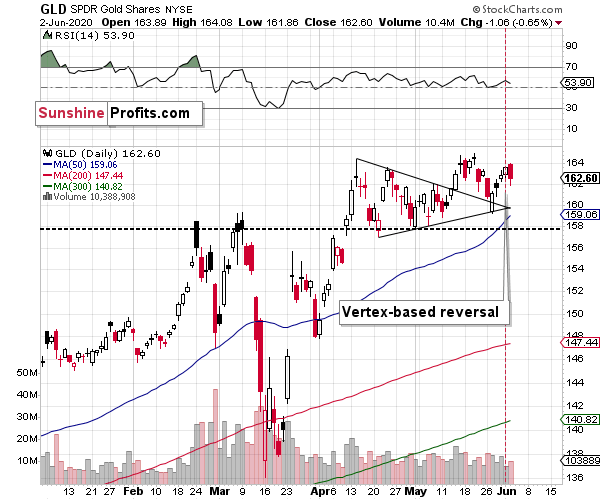
[Monday] As far as the short-term is concerned, we have a good indication from the GLD ETF that the rally is about to end today. This is the case due to the triangle-vertex-based reversal that we have right now. This trading technique has proven to be useful many times in the previous months, so it seems to be worth to pay attention to its indications also this time.
[Tuesday] The GLD ETF has indeed moved higher yesterday (less than 0.5%, though), and gold futures are moving lower in today's pre-market trading (so far declining by about 0.3%). This might have indeed been the top, especially that silver invalidated its tiny breakout above the previous 2020 highs and gold showed weakness relative to declining USD Index.
GLD ultimately declined by 0.65%, which means that it erased more than Monday's gains. The triangle-vertex-based reversal technique seems to have worked once again. This is further confirmed by the fact that gold is once again down in today's pre-market trading – despite lower USD Index values.
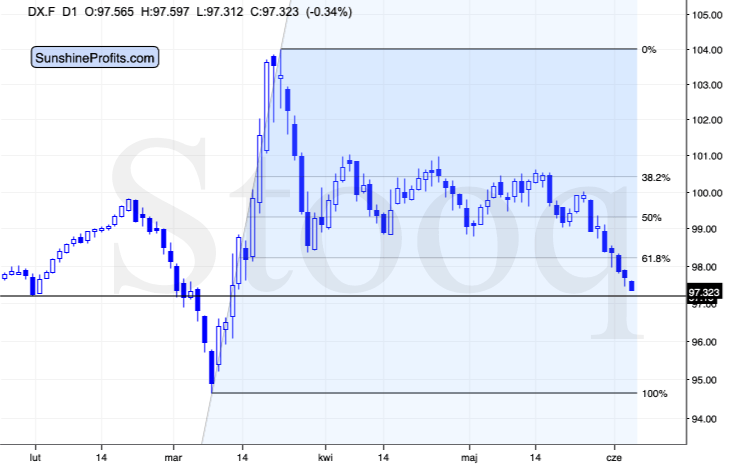
In yesterday's analysis, we emphasized that the length of the current decline is very similar to the length of the February – March decline that we saw right before the big USDX run-up. We also argued that the situation is relatively similar on the fundamental front. To clarify, there are obvious differences, but the key similarity is that it's relatively clear that the Covid- 19 cases are going up and the economic implications are going to be more severe than it is currently perceived in general, but the numbers don't yet reflect that. Which is probably why the USDX is still not soaring and stocks are not yet declining. Again – it's a "yet" in my view.
What we would like to add to the above today is that in March, the USDX bottomed on the third day after breaking below the previous important support (the January low). Today is also the third day when the USD Index moved below the important support in the form of the 61.8% Fibonacci retracement. It could be the case that the big run-up is just around the corner. And since gold is already declining despite the lack of USD's help, such an USDX rally would likely have a devastating effect on the precious metals sector.
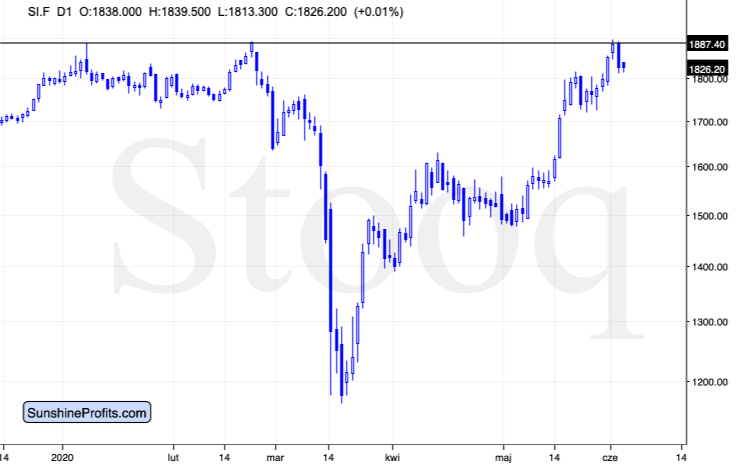
As you can see on the above chart, silver is now visibly below the previous highs, and it's now crystal-clear that silver's small attempt to break to new 2020 highs was invalidated. This is something that we often see as a confirmation that the top is already in, and it seems that this is the case also this time.
Please note that the huge slide below $12 in silver futures started from almost the same levels and it took less than a month for the white metal to move there. If the first part of the slide is similar to what we saw previously, we can expect to see a decline below $17 shortly.
Miners' performance also suggests that another slide is starting. And it's not only because of HUI's profound monthly reversal, or the invalidation of its breakout above the 2016 highs.
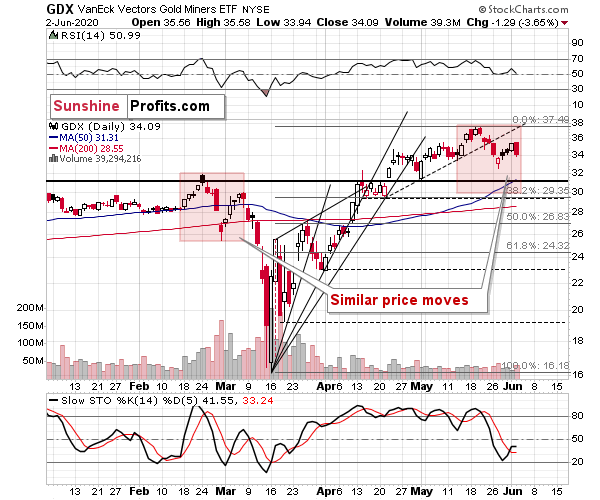
Monday's rally on low volume was followed by a bigger decline on visibly bigger volume. GDX has almost erased three days of gains, declining more on a relative basis than GLD did during the same time. This serves as yet another confirmation that the top is already in.
The thing that we would like to add today is the note about similarity between the price patterns that we saw between mid-February and early March and the last few weeks. The areas marked in red are identical. As you can see the shape of the price moves is very similar, and so is the timing of the price extremes. In fact, the latter is almost identical. "Almost", as it seems the move lower started one day earlier this time.
It's just like the PMs and miners got fed up waiting for the USD's rally and stock market's decline and are moving lower even without them. This is the perfectly bearish situation, because once we do get the above-mentioned signs, the decline is likely to simply accelerate.
Want free follow-ups to the above article and details not available to 99%+ investors? Sign up to our free newsletter today!
Want free follow-ups to the above article and details not available to 99%+ investors? Sign up to our free newsletter today!
Author

Przemyslaw Radomski, CFA
Gold Price Forecast
Przemyslaw Radomski, CFA (PR) is a precious metals investor and analyst who takes advantage of the emotionality on the markets, and invites you to do the same. His company, Sunshine Profits, publishes analytical software that any