Two bearish chart patterns are stacking up on US oil but here is the only thing that matters
WTI crude oil (ticker: USOIL) is one of the most dangerous charts to trade right now. The technical picture is telling a very specific story that traders cannot afford to ignore.
Since the Middle East conflict escalated and the Strait of Hormuz effectively closed to oil and goods transport, WTI crude has been whipping violently on every headline. The volatility is real and the stakes are high. The most important takeaway is the chart has two bearish patterns developing simultaneously.
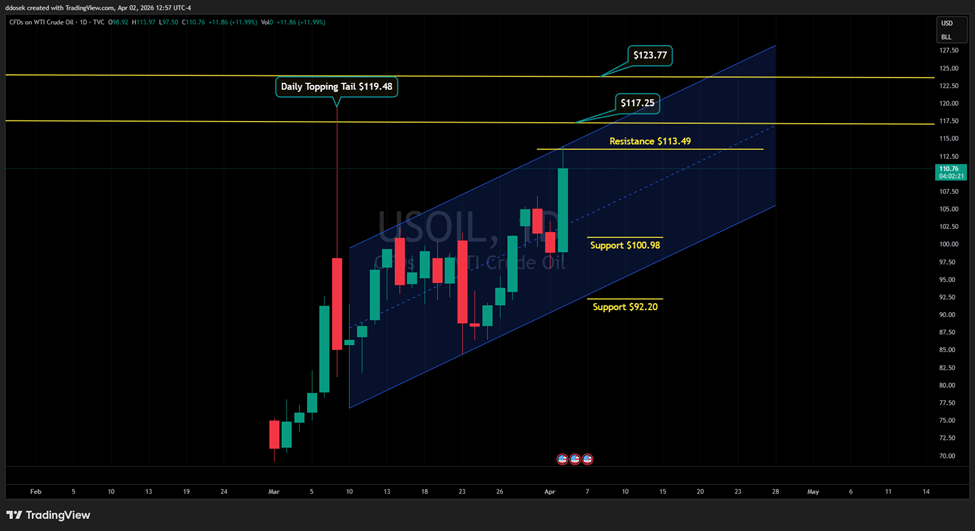
The first pattern formed on March 9th — a daily topping tail at $119.48. A topping tail forms when price pushes sharply higher intraday but fails to hold those gains, closing well off the highs. It is a bearish signal, and it remains in play until price can post a daily close above the top of that tail. That has not happened.
Since that topping tail, price has retreated and consolidated into an inclining parallel channel, which is a bear flag. That makes two bearish patterns stacked on top of each other. This combination increases the probability of further downside pressure on crude.
Today's price action tested the top-end of that parallel channel and has since pulled back, which is exactly what you'd expect from a bear flag holding its structure. Watch this channel top closely in the coming sessions as it converges directly with longer-term resistance at $117.25, followed by $123.77 — both levels drawn from long-term declining trendlines originating from the July 2008 pivot high. Those are significant walls.
But here's the variable that overrides all of it: certainty.
Until there is clarity on the flow of oil through the Middle East, this chart will continue to react violently to every news update. Any meaningful de-escalation or reopening of the Strait shifts the fundamental picture dramatically. US Oil likely falls toward the mid-$70s in that scenario. Before getting there, the first levels of support are at $100.98 and $92.20, both capable of providing a bounce along the way.
The patterns are bearish. The resistance is a firm barrier. But in a geopolitical trade, the news cycle is the wildcard.
Author

Drew Dosek
Verified Investing
Passionate technical and cycle analyst committed to empowering traders through data-driven insights.