Top trade setups in forex – Eyes on US & Canadain labor market report

The U.S. stocks pared early losses to close mixed, as investors prepared for another corporate earnings report season. The Dow Jones Industrial Average slipped 328 points (-1.4%) to 23,390, the S&P 500 declined 28 points (-1.0%) to 2,761, while the Nasdaq 100 rose 94 points (+1.1%) to 8,332.
Retailing (+3.02%), Semiconductors & Semiconductor Equipment (+1.95%) and Technology Hardware & Equipment (+1.06%) sectors performed the best, while Real Estate (-4.59%), Banks (-4.13%) and Consumer Durables & Apparel (-3.67%) sectors lagged behind.
XAU/USD - Bullish Channel In-Play
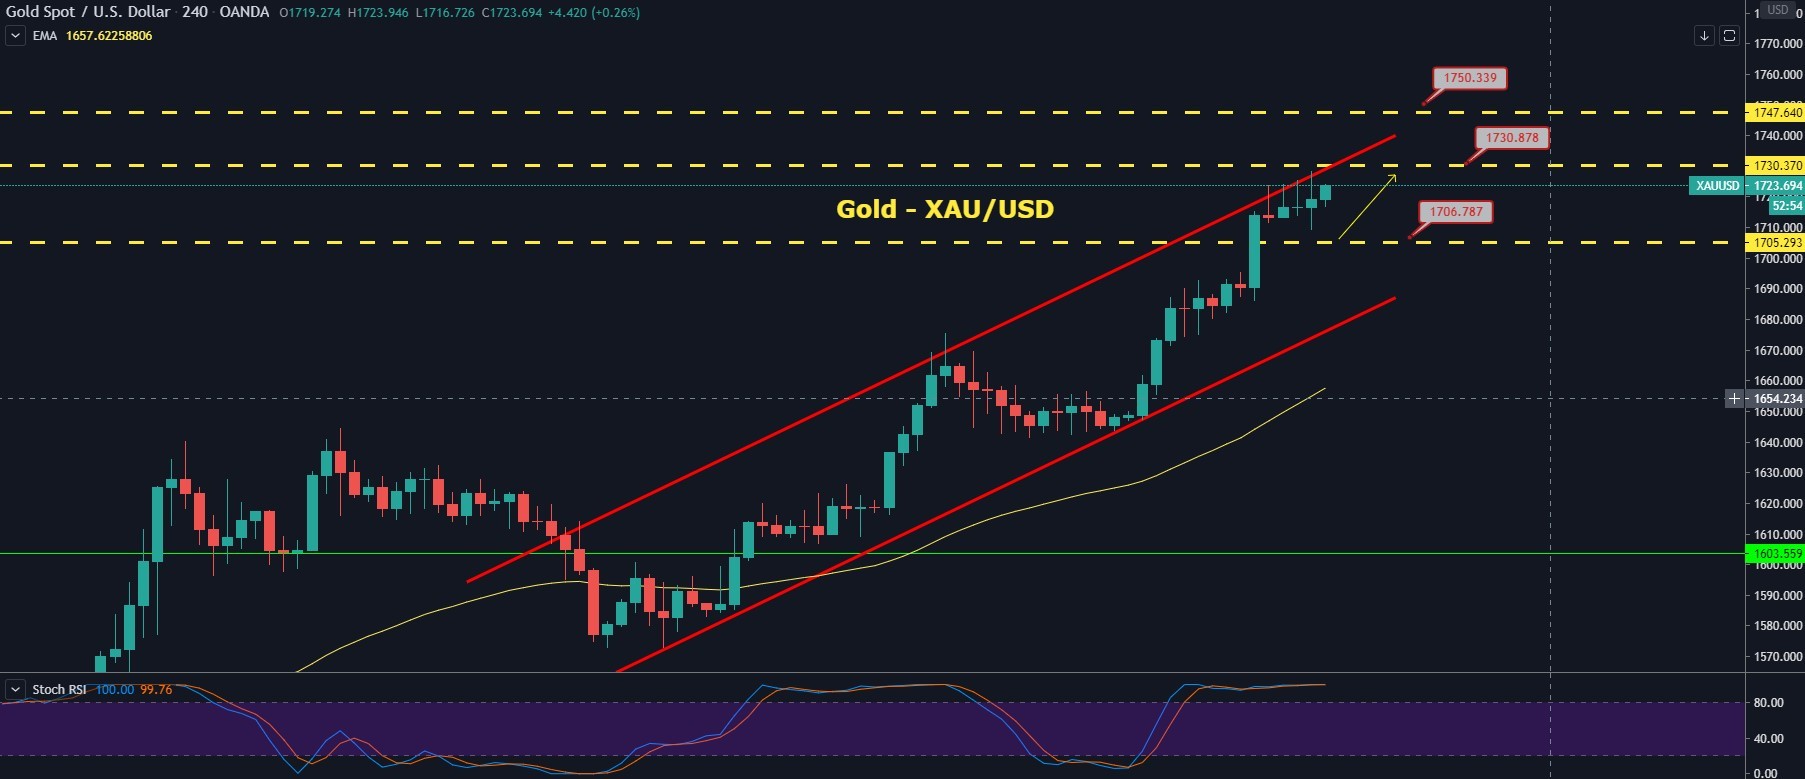
Spot gold jumped 21 dollars or 1.3%) to trade around $1,717 an ounce, the highest level in over seven years. Traders are anticipating additional monetary and fiscal stimulus measures by authorities around the world.
This morning, U.S. President Donald Trump said he would make a decision in conjunction with governors and other officials on reopening the economy shortly. Most European markets were closed on Easter Monday.
The U.S. government bond prices eased, as the benchmark 10-year U.S. Treasury yield added 2.7 basis points to 0.749%. While the futures on the S&P 500 are registering a 1.27% gain at press time and the U.S. dollar continues to lose its momentum across the board. The greenback, which measures the worth of the greenback against majors, is reporting a 0.30% drop.
The economic calendar is empty, so the traders will keep their eyes on the virus updates. Besides, the efforts by the global policymakers to combat the coronavirus may propel the precious metal. So far, the precious metal gold prices are trading sideways due to a lack of high impact economic events.
XAU/USD - Daily Technical Levels
|
Support |
Pivot Point |
Resistance |
|
1688.84 |
1706.11 |
1730.37 |
|
1664.58 |
1747.64 | |
|
1623.05 |
1789.17 |
XAU/USD - Daily Trade Sentiment
The technical side of gold proceeds to present bullish bias as it's prices are trading higher after violating the horizontal resistance level of 1,710. Above this level, the precious metal has strong odds of going further higher until the next resistance level of 1,730 and 1,750.
Most of the bullish trend is supported due to the upward channel and the 50 periods EMA which we can see the 4-hour timeframe. On the lower side, immediate support prevails around 1,710 today. Let's consider staying bullish 1,720 today.
USD/CAD - Triangle Pattern Breaksout
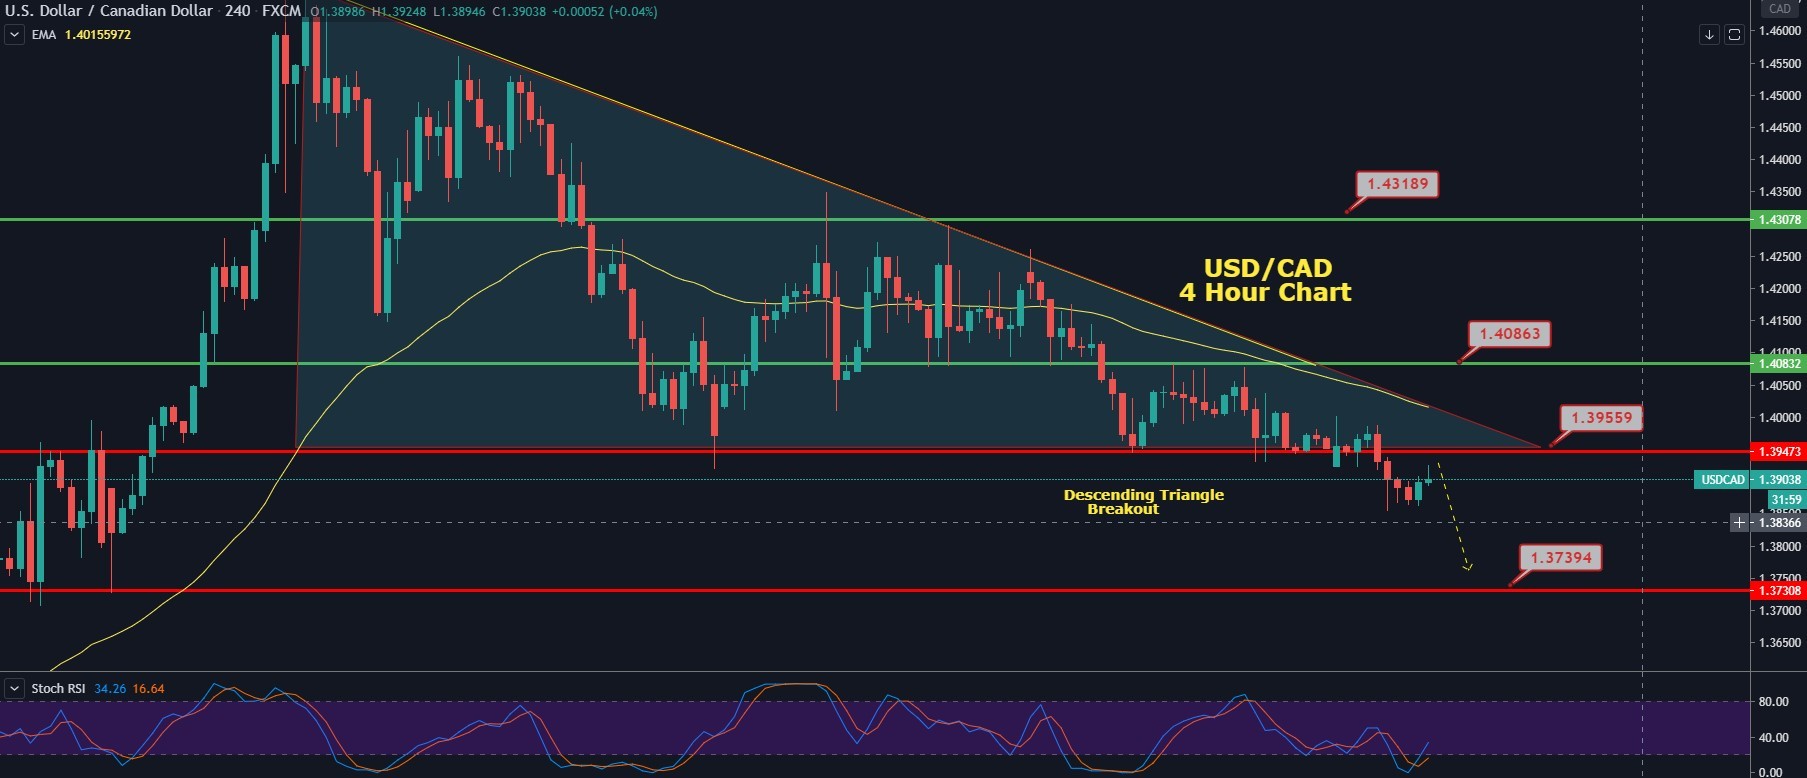
Today in the early European session, the USD/CAD is flashing red and dropped below the 1.3900 mark, or near one-month lows mainly due to the broad-based U.S. dollar weakness despite a pickup in the U.S. bond yields. The USD/CAD is trading at 1.3900 and consolidates in the range between the 1.3861 - 1.3914. However, the weaker oil prices weakness the commodity-linked the loonie demand and extended some support to the pair to cap the downside.
At the USD front, the greenback continues to lose its momentum across the board despite fresh the pickup in the U.S. bond yields. The dollar index, which measures the worth of the dollar against majors, is reporting a 0.30% drop, which was eventually seen as one of the key factors exerting some pressure on pair for the fourth consecutive session on Tuesday.
The USD/CAD traders ignored the weaker tone surrounding crude oil prices, which generally tend to weaken demand for the commodity-linked he loonie and provide support to the currency pair. The fresh recovery in the oil prices turned out to be short-lived, which were caused by showing agreeability over a 9.7 million-barrel cut in daily oil production by OPEC+, mainly due to concerns regarding the unprecedented demand loss from the global COVID-19 trouble and led to some renewed pressure on oil prices.
Looking forward, traders will keep their focus on the oil price dynamics for a fresh impetus and grab some meaningful trading opportunities as we don't have any major market economic data for the day ahead.
USD/CAD- Daily Technical Levels
|
Support |
Pivot Point |
Resistance |
|
1.3845 |
1.3917 |
1.3977 |
|
1.3785 |
1.4049 | |
|
1.3653 |
1.418 |
USD/CAD- Daily Trade Sentiment
Technically, the USD/CAD is trading at 1.3905 after violating the descending triangle pattern on the 4-hour timeframe. The pattern breakout was offering selling bias in the USD/CAD pair, and closing of candles below this has opened further chances of selling in the USD/CAD pair, which can lead its prices until the next support level of 1.3740.
The leading indicator Stochastic and the 50 EMA are suggesting strong selling bias in the pair. With that being said, the USD/CAD pair is likely to find an immediate resistance at 1.3950, and it may help us capture a good selling trade until 1.3730 targets.
AUD/USD – Triple Top Pattern Breakout
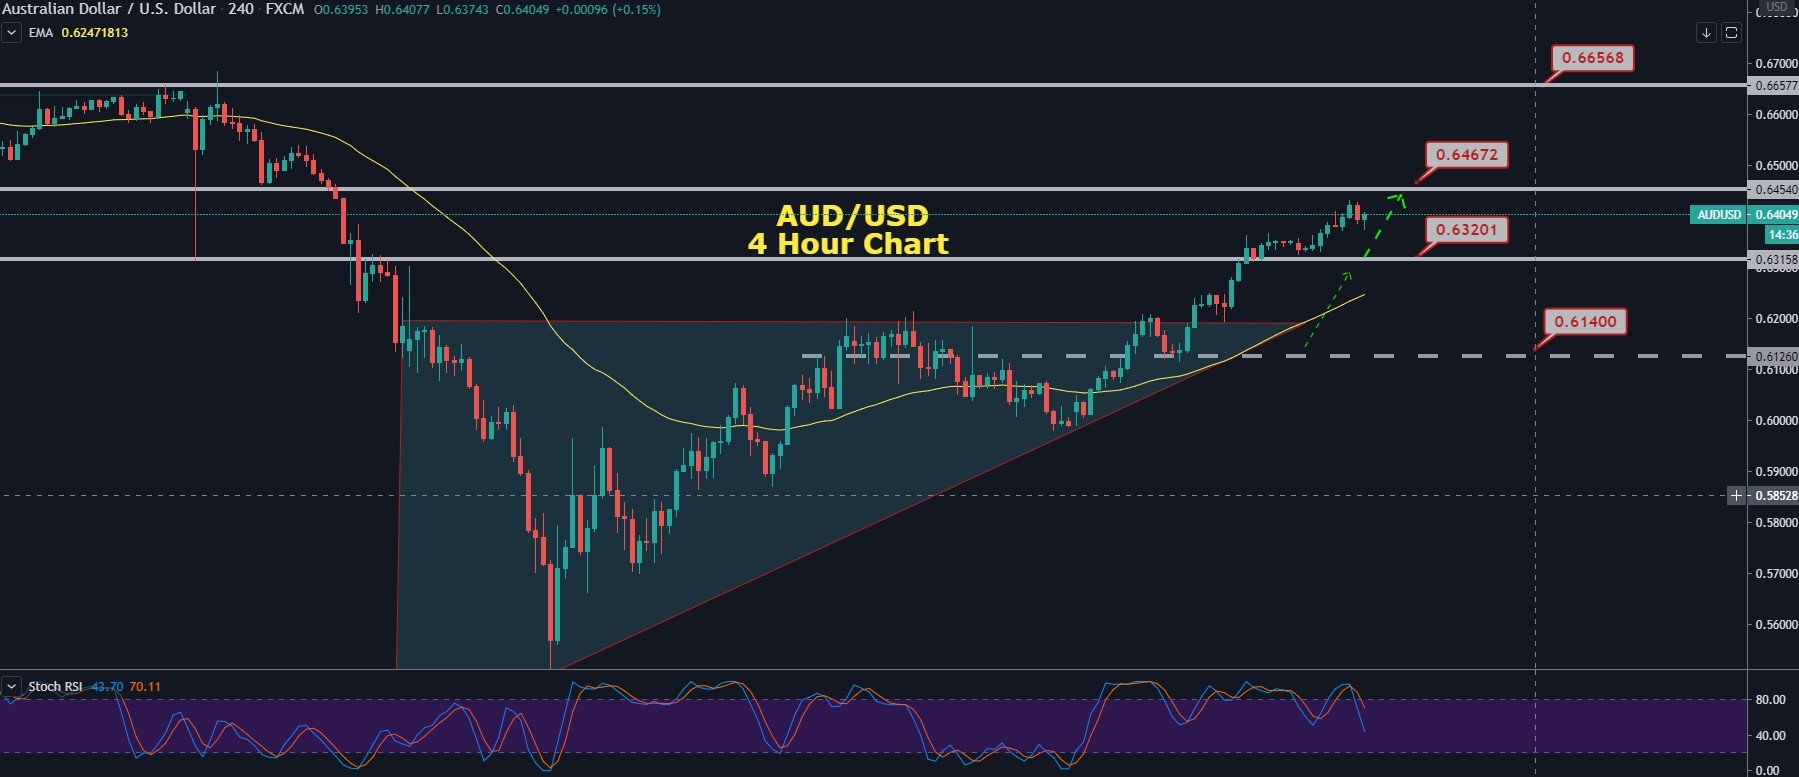
The AUD/USD is flashing green and succeeds in extending its 7th-consecutive session winning streak. The Aussie dollar pair also rose above 50-day SMA near the 0.6432, mainly after the release of better-than-expected Chinese trade balance figures for March. The broad-based USD weakness is helping the pair to hold above.
The AUD/USD is trading at 0.6409 and consolidates in the range between the 0.6377 - 0.6432. While improving global risk sentiment continues to support riskier currencies like Aussie.
At the data front, China's exports improved in March and fell 6-6% YoY as compared to a 17.2% slide in the previous month. Moreover, imports reversed the previous month's decline to rise by 2.4% during the reported month.
The major reason behind the bullish trend in AUD/USD is the global risk-on market sentiment, which keeps the U.S. dollar lower and boosts the China-proxy Australian dollar. This ultimately supports the pair and drives bullish bias, causing AUD/USD to place a higher level since March 12. The futures on the S&P 500 are registering a 1.27% gain at press time, and the U.S. dollar continues to lose its momentum across the board.
AUD/USD - Technical Levels
|
Support |
Pivot Point |
Resistance |
|
0.6339 |
0.6374 |
0.6417 |
|
0.6297 |
0.6452 | |
|
0.6219 | 0.653 |
AUD/USD - Daily Trade Sentiment
The AUD/USD is trading with a bullish bias at 0.6400 after violating the ascending triangle pattern at 0.6200. Aussie is getting prominent in the wake of improvement in China, as they lifted the lockdown in Wuhan during the previous week. The AUD/USD has concluded several candles over 0.6300 resistance, which at the moment is working as a support.
The RSI has crossed below 50, which is now suggesting the bearish bias in the AUD/USD pair, which is why we may see slight selling in the AUD/USD pair until 0.6350 before seeing further upward movement in the market. Today, let's consider staying bullish over 0.6370 and bearish below 0.6467. All the best for the U.S. Session!
Author

EagleFX Team
EagleFX
EagleFX Team is an international group of market analysts with skills in fundamental and technical analysis, applying several methods to assess the state and likelihood of price movements on Forex, Commodities, Indices, Metals and