The US President got his first trade deal with the UK

USD: Jun '25 is Down at 100.290.
Energies: Jun '25 Crude is Up at 61.00.
Financials: The Jun '25 30 Year T-Bond is Lower by 9 ticks and trading at 114.04.
Indices: The Jun '25 S&P 500 emini ES contract is 32 ticks Higher and trading at 5632.50.
Gold: The Jun'25 Gold contract is trading Up at 3329.80.
Initial conclusion
This is not a correlated market. The USD is Down and Crude is Up which is normal, and the 30 Year T-Bond is trading Lower. The Financials should always correlate with the US dollar such that if the dollar is Higher, then the bonds should follow and vice-versa. The S&P is Higher and Crude is trading Higher which is not correlated. Gold is trading Higher which is correlated with the US dollar trading Down. I tend to believe that Gold has an inverse relationship with the US Dollar as when the US Dollar is down, Gold tends to rise in value and vice-versa. Think of it as a seesaw, when one is up the other should be down. I point this out to you to make you aware that when we don't have a correlated market, it means something is wrong. As traders you need to be aware of this and proceed with your eyes wide open. Asia traded Higher except the Shanghai and Sensex exchanges. All of Europe is trading Higher.
Possible challenges to traders
- FOMC Member Barkin Speaks at 8:30 AM EST. This is Major.
- FOMC Member Williams Speaks at 8:30 AM EST. This is Major.
- FOMC Member Goolsbee Speaks at 10 AM EST. This is Major.
- FOMC Member Waller Speaks at 11:30 AM EST. This is Major.
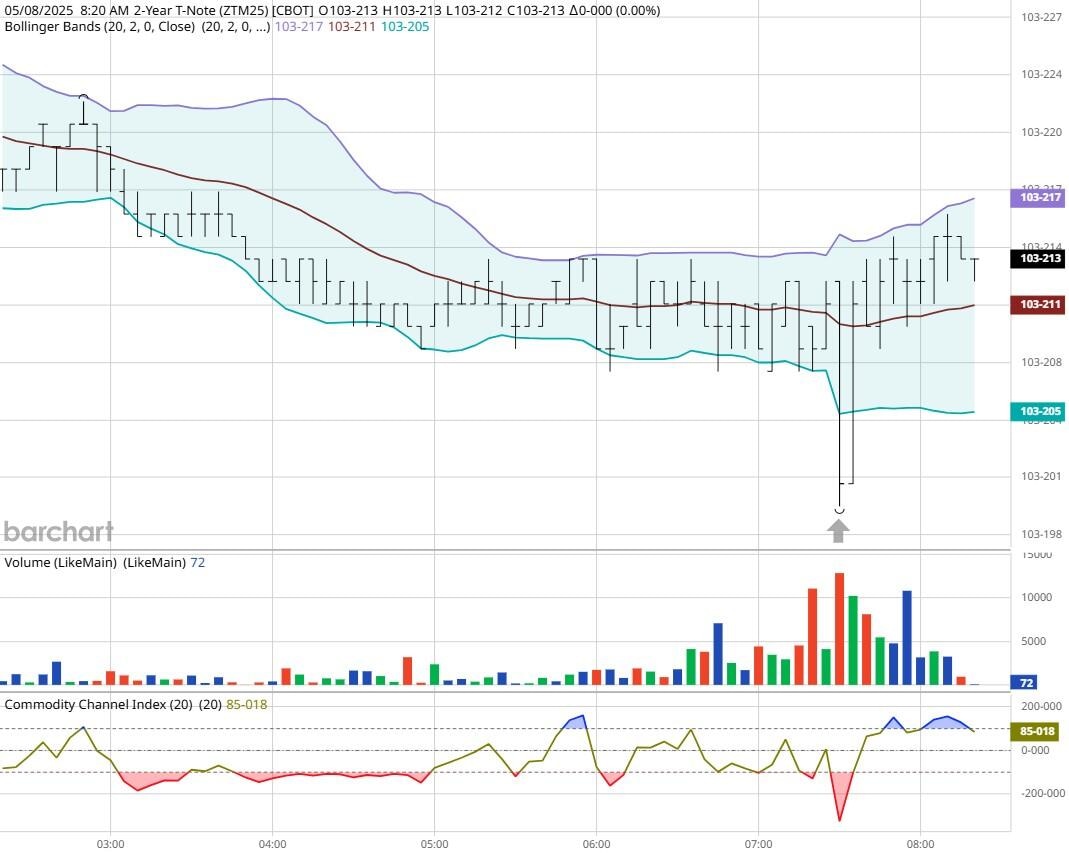
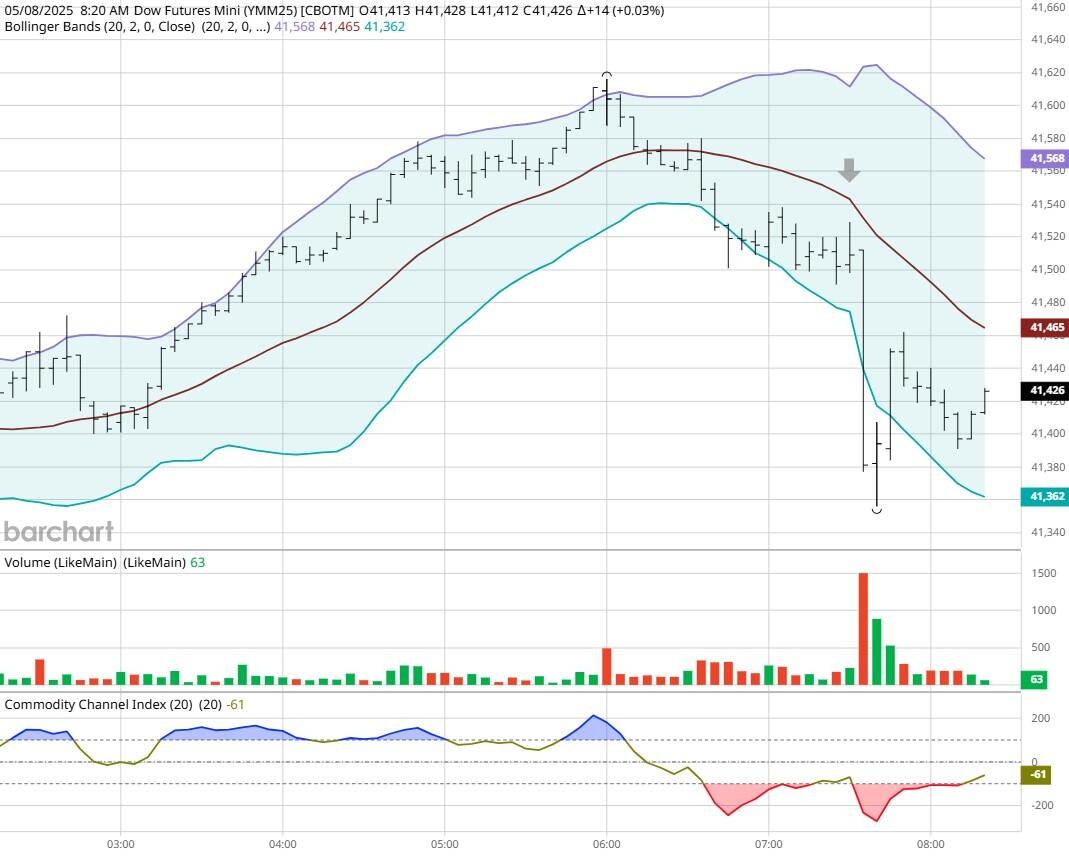
Traders, please note that we've changed the Bond instrument from the 10 Year (ZN) to the 2 Year (ZT). They work exactly the same.
We've elected to switch gears a bit and show correlation between the 2-year Treasury notes (ZT) and the S&P futures contract. The YM contract is the Dow Jones Industrial Average, and the purpose is to show reverse correlation between the two instruments. Remember it's likened to a seesaw, when up goes up the other should go down and vice versa.
Yesterday the ZT climbed Higher at around 8:30 AM EST with Unemployment Claims pending. The Dow dropped Lower at the same time. Look at the charts below and you'll see a pattern for both assets. The Dow moved Lower at 8:30 AM EST and the ZT moved Higher at around the same time. These charts represent the newest version of Bar Charts, and I've changed the timeframe to a 15-minute chart to display better. This represented a Long opportunity on the 2-year note, as a trader you could have netted a dozen plus ticks per contract on this trade. Each tick is worth $6.25. Please note: the front month for ZT is now Jun '25 and the Dow is Jun '25 as well. I've changed the format to filled Candlesticks (not hollow) such that it may be more apparent and visible.
Charts courtesy of barcharts
Dow -Jun 2025 - 5/08/25
ZT - Mar 2025- 5/08/25
Bias
Yesterday we gave the markets a Mixed bias as we didn't see much in the way of Market Correlation Thursday morning. The markets veered to the Upside as the Dow closed 254 points Higher and the other indices closed in positive territory as well. Today we aren't dealing with a correlated market, and our bias is to the Upside.
Could this change? Of Course. Remember anything can happen in a volatile market.
Commentary
So yesterday marked the 80th anniversary of the end of WW2 in Europe. Yesterday was marked by two other events. The President got his first trade deal with the UK and for the first time in history an American was elected Pope in Rome. I never thought we would ever see that but here we have it. I would bet that President Donnie 2 Dolls was bouncing off the walls when he heard that news. He was probably thinking "thank God all my sins are forgiven." Sorry to say prez, the Pope doesn't report to you either.
Author

Nick Mastrandrea
Market Tea Leaves


