The jobs recovery is not yet half-way as progress slows

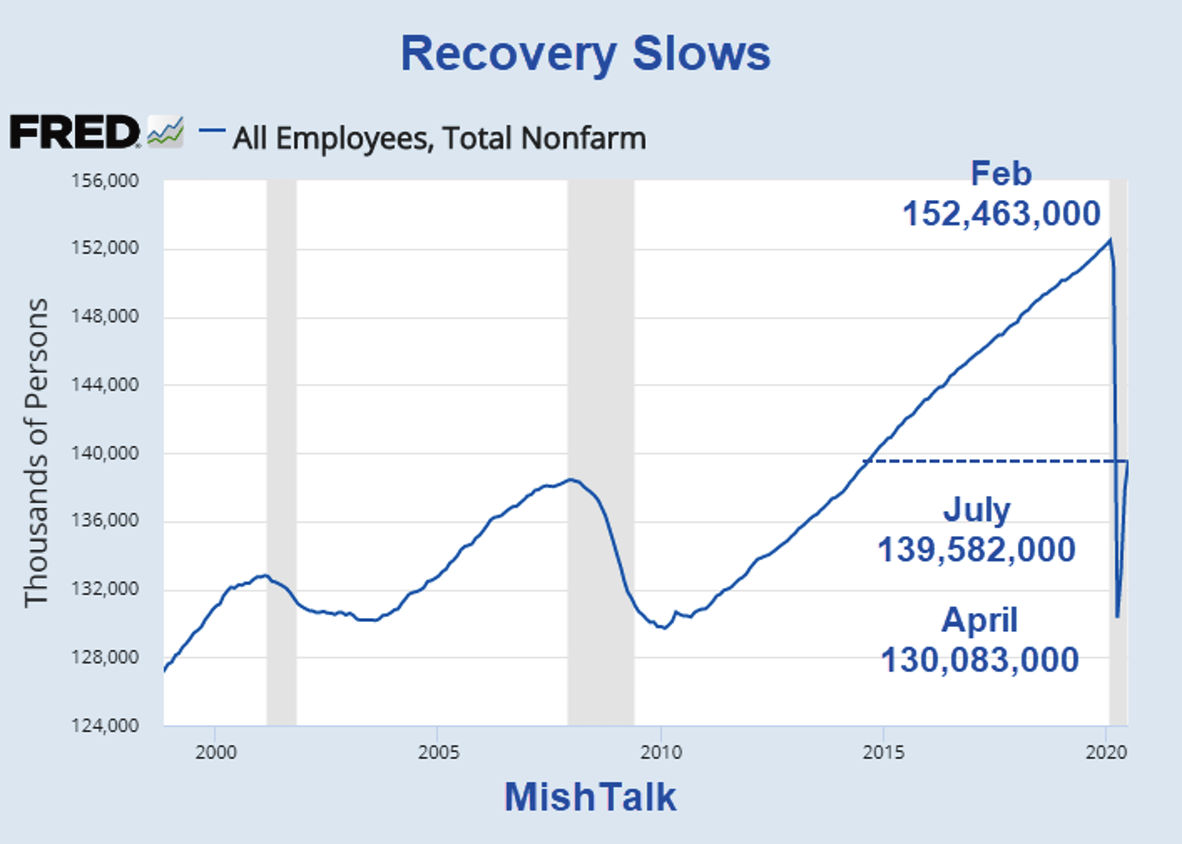
Employment rose by 1.8 million in July nearly in line with the economic consensus.
The BLS Employment Report for July shows employment rose by 1.8 million in July following a gain of 4.8 million in June, and 2.7 million in May. The unemployment rate fell slightly to 10.2%.
Initial Reaction
The Bloomberg Econoday consensus jobs estimate was +1.677 million and the unemployment rate consensus was 10.5%.
The BLS said that errors that plagued the household survey since March was not as bad this month.
BLS Error Rate
For March through June, BLS published an estimate of what the unemployment rate would have been had misclassified workers been included. Repeating this same approach, the overall July unemployment rate would have been about 1 percentage point higher than reported. However, this represents the upper bound of our estimate of misclassification and probably overstates the size of the misclassification error.
According to usual practice, the data from the household survey are accepted as recorded. To maintain data integrity, no ad hoc actions are taken to reclassify survey responses. Add 1 percentage to unemployment rate for a better estimate.
Job Revisions
The change in total nonfarm payroll employment for May was revised up by 26,000, from +2,699,000 to +2,725,000, and the change for June was revised down by 9,000, from +4,800,000 to +4,791,000. With these revisions, employment in May and June combined was 17,000 higher than previously reported. (Monthly revisions result from additional reports received from businesses and government agencies since the last published estimates and from the recalculation of seasonal factors.)
BLS Jobs Statistics at a Glance
- Nonfarm Payroll: +1,800,000 - Establishment Survey
- Employment: +1,350,000 - Household Survey
- Unemployment: -1,412,000 - Household Survey
- Baseline Unemployment Rate: -0.9 to 10.2% - Household Survey
- U-6 unemployment: -1.5 to 16.5% - Household Survey
- Civilian Non-institutional Population: +169,000
- Civilian Labor Force: -620,000 - Household Survey
- Not in Labor Force: +230,000 - Household Survey
- Participation Rate: -0.1 to 61.4% - Household Survey
Part-Time Jobs
- Total Part-Time Work Change: -1,571.000
- Involuntary Part-Time Work: -1,605,000 - Household Survey
- Voluntary Part-Time Work: +2,743,000 - Household Survey
Don't try to make sense of those numbers as they never add up. I list them as reported.
BLS Employment Report Statement
Total nonfarm payroll employment rose by 4.8 million in June, and the unemployment rate declined to 11.1 percent, the U.S. Bureau of Labor Statistics reported today. These improvements in the labor market reflected the continued resumption of economic activity that had been curtailed in March and April due to the coronavirus (COVID-19) pandemic and efforts to contain it. In June, employment in leisure and hospitality rose sharply. Notable job gains also occurred in retail trade, education and health services, other services, manufacturing, and professional and business services.
Unemployment Rate – Seasonally Adjusted
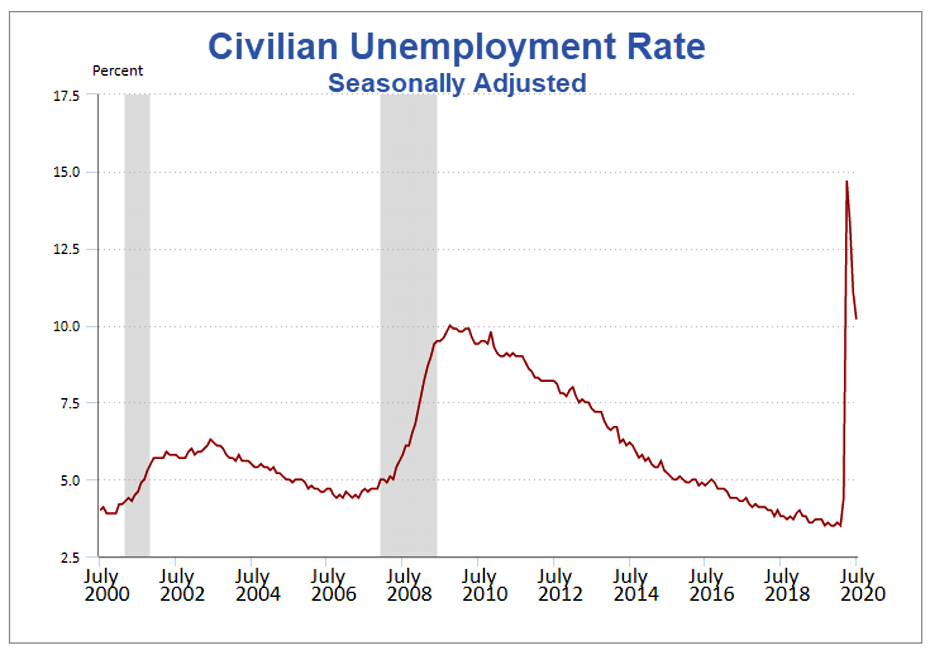
The above Unemployment Rate Chart is from the BLS. Click on the link for an interactive chart.
Hours and Wages
Average weekly hours of all private employees declined 0.1 hours to 34.5 hours. Average weekly hours of all private service-providing employees decline 0.1 hours to 33.5 hours. Average weekly hours of manufacturers rose 0.7 hours to at 39.7 hours.
Average Hourly Earnings of All Nonfarm Workers rose $0.07 to $29.39.
Year-over-year, wages rose from $28.05 to $29.39. That's a gain of 4.7%.
The month-to-month and especially year-over-year gains are very distorted because more higher-paid workers kept their jobs than lower-paid employees.
Average hourly earnings of Production and Supervisory Workers fell $0.11 to $24.63.
The decline is a good thing in that reflects more people returning to work.
Year-over-year, wages rose from $23.54 to $24.63. That's a gain of 4.6%.
For a discussion of income distribution, please see What’s “Really” Behind Gross Inequalities In Income Distribution?
Birth Death Model
Starting January 2014, I dropped the Birth/Death Model charts from this report.
For those who follow the numbers, I retain this caution: Do not subtract the reported Birth-Death number from the reported headline number. That approach is statistically invalid.
BLS Covid-19 Statement on the Birth-Death Model
The widespread disruption to labor markets due to the COVID-19 pandemic and the potential impact to the birth-death model have prompted BLS to both revisit research conducted in the aftermath of the Great Recession (2008-2009) and incorporate new ideas to account for changes in the number of business openings and closings. Two areas of research have been implemented to improve the accuracy of our birth-death model in the CES estimates. These adjustments will better reflect the net effect of the contribution of business births and deaths to the estimates. These two methodological changes are the following:
1: A portion of both reported zeros and returns from zero in the current month from the sample were used in estimation to better account for the fact that business births and deaths will not offset.
2: Current sample growth rates were included in the net birth-death forecasting model to better account for the changing relationships between business openings and closings.
BLS will determine on a monthly basis if the adjusted birth-death model described here continues to be necessary. We will disclose these changes each month in the Employment Situation news release. All months in the tables of net birth-death forecasts on this page include footnotes for any month in which a regressor was used to supplement the forecasts.
The Birth-Death model is essentially garbage but we likely will not find how distorted this is until the annual revisions next year.
Author

Mike “Mish” Shedlock's
Sitka Pacific Capital Management,Llc


