|

NZD/USD technical analysis: Exhibits sturdy bullish bias; upside pressure persists

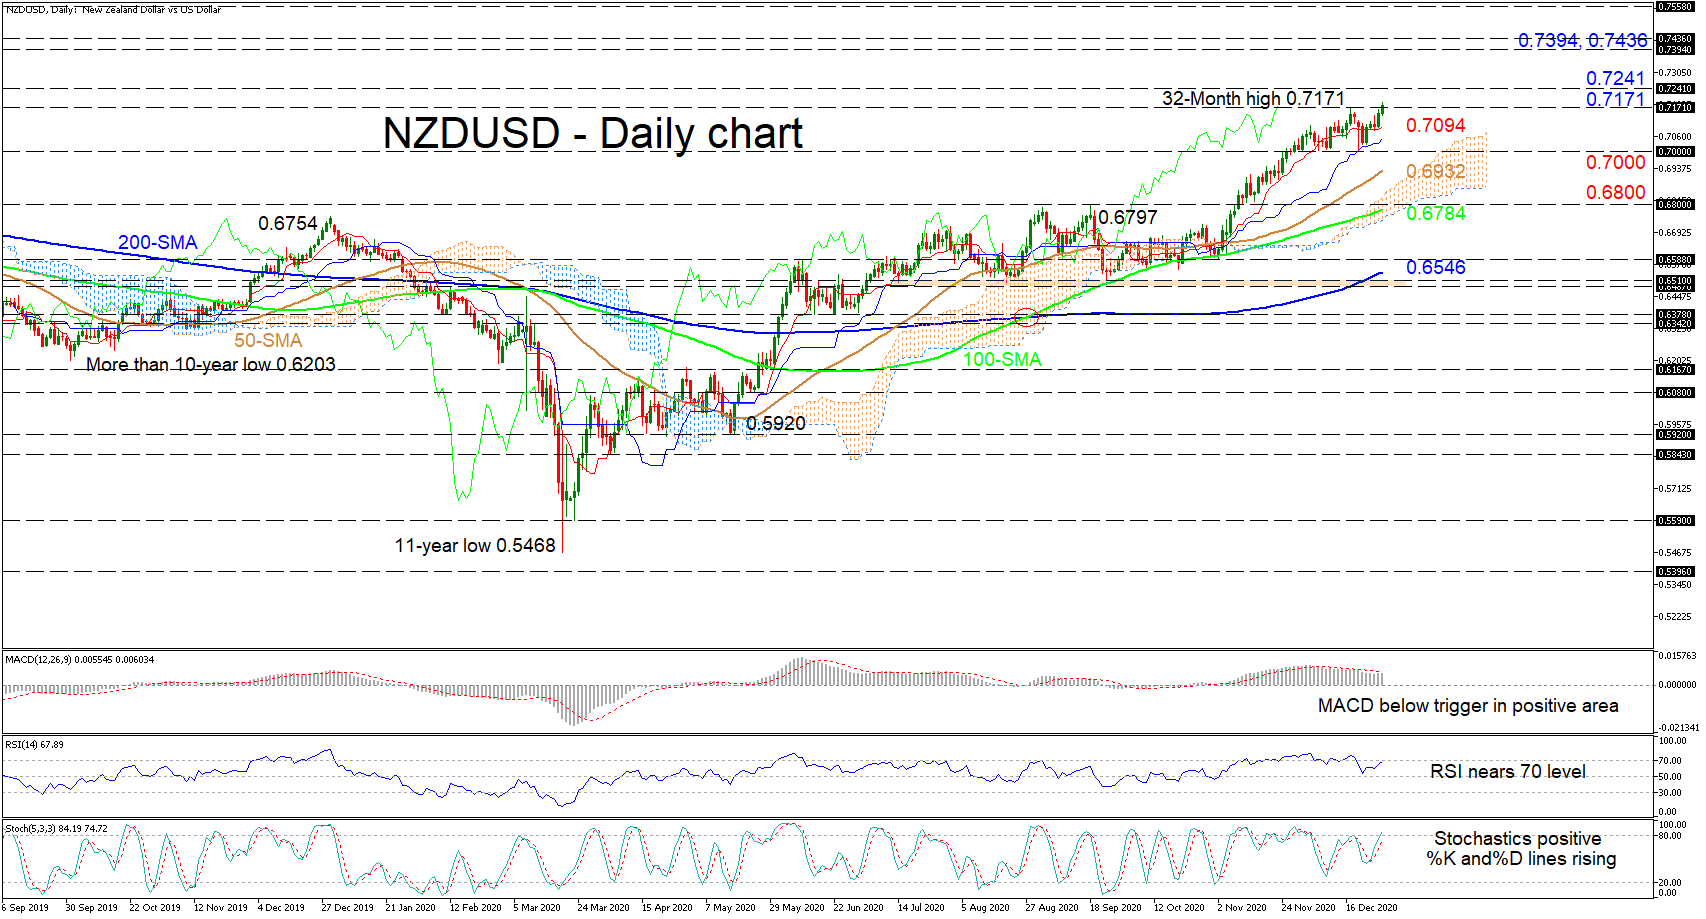
NZDUSD is in the process of pushing past the fresh 32-month peak of 0.7171 after having recently found some traction off the blue Kijun-sen line. All the simple moving averages (SMAs) are defending the positive structure, while the bullish Ichimoku lines are endorsing positive price action.

Likewise, the short-term oscillators are leaning towards further improvements in the pair. The MACD, some distance in the positive area, is below its red trigger line but looks set to return back above it, while the rising RSI is heading for the 70 overbought mark. Besides that, promoting positive sentiment is the bullish stochastic oscillator, together with the piercing of its %K line above the 80 level.

Resistance may originate from the nearby 0.7241 barrier if the bulls decisively clear the multi-year high of 0.7171. Overcoming this, the price may propel towards the respective 0.7394 and 0.7436 highs from April and January of 2018.

Otherwise, should buyers’ efforts be capped, sellers may find initial support from the red Tenkan-sen line at 0.7094 ahead of the key 0.7000 handle. Slipping under these lows, the pair may then meet the 50-day SMA at 0.6932. From here, should the price retrace into the cloud, the bears may then be challenged by the critical 0.6800 border and the reinforcing 100-day SMA of 0.6784 underneath.

Overall, NZDUSD maintains a robust short-to-medium-term bullish bias above the SMAs and the 0.7000 mark.

NZDUSD

Author

Anthony Charalambous, CFTe

Anthony Charalambous joined XM in 2019 and specializes in preparing daily technical analysis, using his years of trading experience to provide detailed forecasting for all major asset classes such as forex, indices, commodities and equities.

More from Anthony Charalambous, CFTe
Share:

Editor's Picks

EUR/USD holds firm above 1.1900 as US NFP looms

EUR/USD holds its upbeat momentum above 1.1900 in the European trading hours on Wednesday, helped by a broadly weaker US Dollar. Markets could turn cautious later in the day as the delayed US employment report for January will takes center stage. 

GBP/USD remains above nine-day EMA near 1.3650

GBP/USD recovers its recent losses from the previous session, trading around 1.3680 during the European hours on Wednesday. The technical analysis of the daily chart indicates a sustained bullish bias, as the pair trades within an ascending channel pattern.

Gold sticks to gains near $5,050 as focus shifts to US NFP

Gold holds moderate gains near the $5,050 level in the European session on Wednesday, reversing a part of the previous day's modest losses amid dovish US Federal Reserve-inspired US Dollar weakness. This, in turn, is seen as a key factor acting as a tailwind for the non-yielding yellow metal ahead of the critical US NFP release. 

US Nonfarm Payrolls expected to show modest job gains in January

The United States Bureau of Labor Statistics will release the delayed Nonfarm Payrolls data for January on Wednesday at 13:30 GMT. Investors expect NFP to rise by 70K following the 50K increase recorded in December.

S&P 500 at 7,000 is a valuation test, not a liquidity problem

The rebound from last week’s drawdown never quite shook the sense that it was being supported by borrowed conviction. The S&P 500 once again tested near the 7,000 level (6,986 as the high watermark) and failed, despite a macro backdrop that would normally be interpreted as supportive of risk.

Bitcoin price slips below $67,000 ahead of US Nonfarm Payrolls data

Bitcoin price extends losses, and trades below the lower consolidating boundary at $67,300 at the time of writing. A firm close below this level could trigger a deeper correction for BTC. Despite the weakness in price action, institutional demand shows signs of support, recording mild inflows in ETFs so far this week.