Technical Analysis #C-WHEAT : 2018-10-25

Forecasts of bigger crop bearish for wheat prices
Russia and Ukraine estimate higher wheat exports. Will the wheat price continue declining?
Since the start of the 2018/19 marketing season Russia, a major global grain exporter, has exported 17.7 million tons of grains as of October 18, according to Russia’s Ministry of Agriculture data. The export is up 21 percent compared with the same period of the last season. The wheat export is up 34.3% to 15.2 million tons. And Russian agricultural consultancy IKAR upgraded Russia’s wheat export forecast to 33.0 million tons from 32.5 million on back of bigger wheat harvest, a 1.5% increase. At the same time Ukraine looks set to harvest its second-largest grain crop ever this year, with total production of around 64 million metric tons. Ukraine’s Ministry of Agrarian Policy and Food estimates it could export approximately two-thirds of that total by the end of next June. Forecasts of increasing wheat production are bearish for wheat prices.
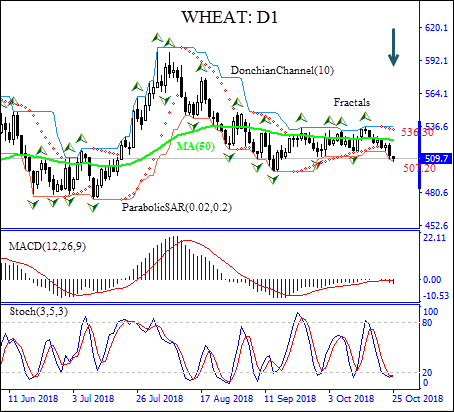
On the daily timeframe the WHEAT: D1 is below the 50-day moving average MA(50) which is falling, this is bearish.
-
The Parabolic indicator gives a sell signal.
-
The Donchian channel indicates downtrend: it is tilted lower.
-
The MACD indicator gives a bearish signal: it is below the signal line and the gap is widening.
-
The Stochastic oscillator has breached into the oversold zone, this is bullish.
We believe the bearish momentum will continue after the price breaches below the lower boundary of Donchian channel at 507.20 This level can be used as an entry point for placing a pending order to sell. The stop loss can be placed above the upper Donchian boundary at 536.30. After placing the order, the stop loss is to be moved every day to the next fractal high, following Parabolic signals. Thus, we are changing the probable profit/loss ratio to the breakeven point. If the price meets the stop loss level (536.30) without reaching the order (507.20), we recommend cancelling the order: the market has undergone internal changes which were not taken into account.
Technical Analysis Summary
|
Position |
Sell |
|
Sell stop |
Below 507.20 |
|
Stop loss |
Above 536.30 |
Want to get more free analytics? Open Demo Account now to get daily news and analytical materials.
Want to get more free analytics? Open Demo Account now to get daily news and analytical materials.
Author

Dmitry Lukashov
IFC Markets
Dimtry Lukashov is the senior analyst of IFC Markets. He started his professional career in the financial market as a trader interested in stocks and obligations.


