|

Technical analysis: Will the soybean price continue rising?

Recommendation for Soybean: Buy

Buy Stop: Above 1422

Stop Loss: Below 1264

RSI: Neutral

MACD: Buy

MA(200): Buy

Fractals: Buy

Parabolic SAR: Buy

Donchian Channel: Neutral

Chart analysis
Soyb

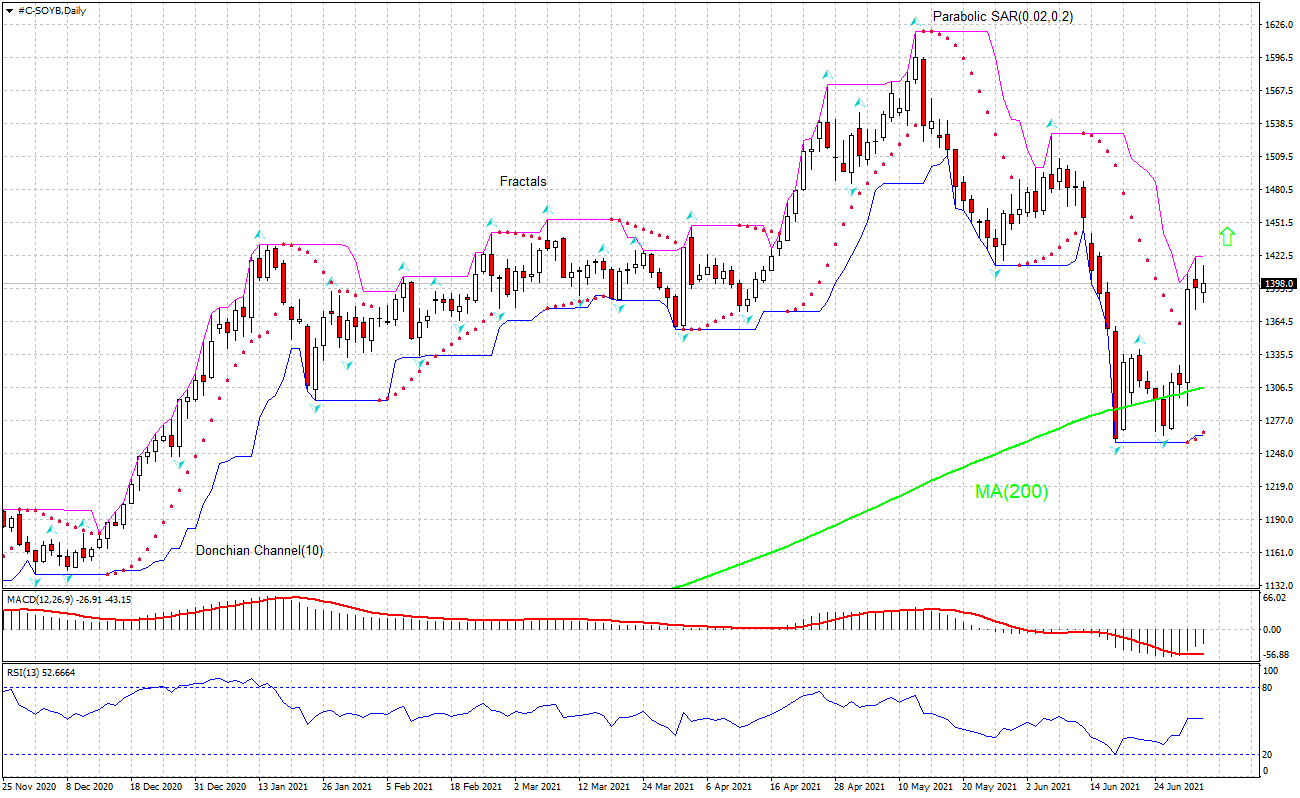
The #C-SOYB technical analysis of the price chart on daily timeframe shows #C-SOYB,Daily has breached above the 200-day moving average MA(200), which is rising itself. We believe the bullish momentum will continue as the price breaches above upper Donchian boundary at 1422. A pending order to buy can be placed above that level. The stop loss can be placed below the lower Donchian boundary at 1264. After placing the order, the stop loss is to be moved every day to the next fractal low, following Parabolic signals. Thus, we are changing the expected profit/loss ratio to the breakeven point. If the price meets the stop loss level without reaching the order, we recommend cancelling the order: the market has undergone internal changes which were not taken into account.

Fundamental analysis

US soybean stocks were down while export sales were up according to latest USDA reports. Will the SOYBEAN price continue rising? US Department of Agriculture reported soybean stocks were down and net sales were up - according to US Grain Stocks and Export Sales reports. Thus, soybeans stored on June 1, 2021 totaled 767 million bushels, down 44% from June 1, 2020. And soybeans net sales were up 62% from the prior 4-week


Want to get more free analytics? Open Demo Account now to get daily news and analytical materials.


Want to get more free analytics? Open Demo Account now to get daily news and analytical materials.

Author

Dmitry  Lukashov

Dmitry Lukashov

IFC Markets

Dimtry Lukashov is the senior analyst of IFC Markets. He started his professional career in the financial market as a trader interested in stocks and obligations.


More from Dmitry Lukashov
Share:

Editor's Picks

AUD/USD flirts with 0.7000, lowest since early August amid bullish USD

AUD/USD hits a fresh low since early August during the Asian session on Friday and looks vulnerable near 0.7000 after breaking below the 200-day SMA overnight. Against the backdrop of the hawkish Fed, a two-day rally in oil prices revives inflation fears and continues to push US bond yields to multi-year highs. Adding to this, geopolitical risks lift the US Dollar to a two-month high, overshadowing RBA rate hike bets and weighing on the pair.

USD/JPY pulls back from three-week high after failing near 159.00

USD/JPY edges lower during the Asian session on Friday, stalling its recent strong move to a three-week high of 159.00 as Japanese Yen bears turn cautious amid intervention fears. Meanwhile, the US Dollar retains a strong bullish undertone as the Fed's hawkish outlook and oil-driven inflation fears continue to push US bond yields to multi-year peaks. Furthermore, the BoJ's dovish rate hike last week might cap JPY and support spot prices.

Gold treads water below $4,300

Gold grabs some buying attention and advances marginally at the end of the week, partially retracing the weekly decline, although it is still navigating below the key $4,300 mark per troy ounce. The fresh selling bias on the Greenback and the modest decline in US Treasury yields appear to support the humble advance in the precious metal.

Crypto Today: Bitcoin and Ethereum edge lower, XRP extends recovery as macro headwinds weigh

The broader cryptocurrency market is consolidating on Friday, with Bitcoin paring losses slightly above $84,000. Ethereum declines in tandem with BTC. Ripple (XRP), meanwhile, paints a different picture.


Fed vs BoJ: Both hiked. The market only believes one of them – and the chart shows which
The Federal Reserve (Fed) and the Bank of Japan (BoJ) have just done something remarkably similar. Both central banks raised interest rates by 25 basis points (bps) last week, both are confronting inflation risks, and both signal that future decisions will depend on incoming economic data.
Fed vs BoJ: Both hiked. The market only believes one of them – and the chart shows which

The Fed and the BoJ have just done something remarkably similar. Both central banks raised interest rates by 25 bps last week, both are confronting inflation risks, and both signal that future decisions will depend on incoming economic data.













