Taking a shot from the bear side

Stocks
Yesterday I wrote a bit that follows up on prior work I have done showing that bad breadth near the ATH is not empirically bearish. Coincidentally, Jonathan Krinsky, the esteemed technician/Managing Director at BTIG, has been writing with a lean in the opposite direction recently, highlighting his concerns about bad breadth. His work on index vs. breadth divergence has particularly focused on some market structure similarities to the 2000 bubble pop, particularly within the semiconductor universe. His 2000 vs. now SOX analog, for example, has held remarkably well through recent ups and downs.
Anyway, if you don’t subscribe to his stuff, you definitely should. He emailed me yesterday to kind of / sort of rebut what I had said about breadth—his point was that bad breadth at the ATH in isolation is not necessarily bearish, as I have shown, but bad breadth near the ATH with treasury vol near 52-week highs and HY widening should be more concerning.
I am always nervous about overparameterizing backtests and event studies in search of bearish patterns because this is an important way permabears have stayed wrong throughout the S&P 500 rally from 1000 to 8000, 2009 to 2026. If you look hard enough, you can always find a combination of variables that is in force today and was bearish in the past. This is especially true now that Claude has turned backtesting into a trivial task for anyone with experience. But all that said—treasury vol at a 1-year high and high-yield widening are logical conditions that don’t feel like cherry picking.
So, I ran it. Keep in mind that it is generally rare to find any backtest of initial conditions that shows bearish forward returns in an asset that has gone up eightfold over the period tested. The trend often dominates the output. So if you find something bearish without cherry picking or overtuning your parameters, it’s definitely interesting. So combining my conditions with Jonathan’s, I tested:
- SPX within 5% of its all-time high.
- MOVE at least 80% of its 52-week high.
- HYG ÷ Treasury index ratio below its 50-day average, meaning high-yield spreads are wider than their recent norm.
- NYSE net new highs below zero.
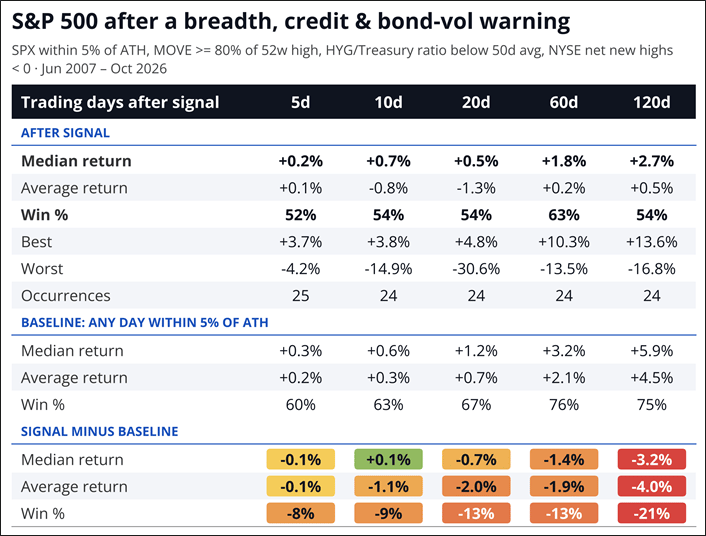
The results are convincingly bearish relative to baseline, but not outright bearish. The signal tends to precede six months of unusually weak returns.
- Six months of weaker-than-baseline returns. Over 120 days, the SPX gained about 0.5% on average, vs. 4.5% for a normal day near the highs. Only 54% of signals were followed by a gain, vs. 75% normally.
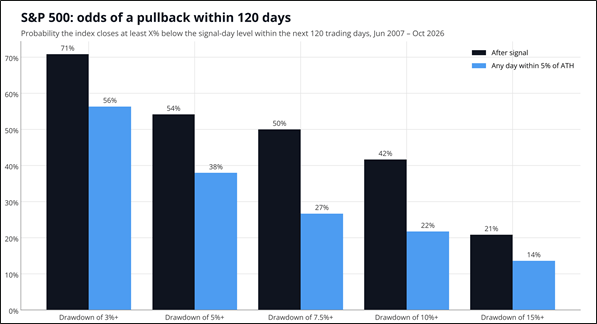
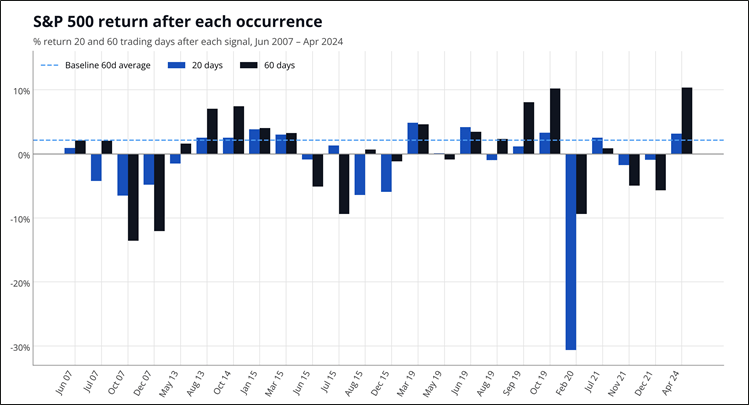
- Bigger pullbacks are more likely (see bar chart below). After a signal, SPX fell 10% or more at some point within 120 days 42% of the time, against 22% normally. It fell 5% or more 54% of the time, against 38%.
- Not a fluke of the exact numbers that I picked. Using nearby round numbers: 2/3/5/10% from the high, MOVE at 70/80/90% of its high, and net new highs below 0/-50/-100. Every version with at least 5 signals shows a weaker 120-day return than the baseline, by 2% to 10%.
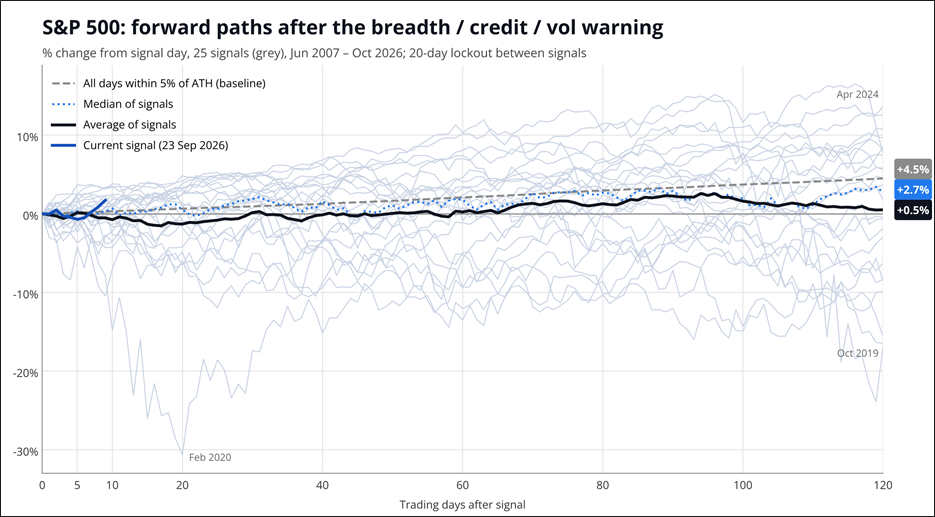
- The signals come in clusters. The 2007 cluster came before the financial crisis and the 2015 cluster before the 2015–16 correction. The 2021 cluster came before the 2022 bear market. The 2019 cluster was a false alarm until Covid hit in 2020. Signals are locked out for 20 days, so the 60- and 120-day returns sometimes overlap.
- Today is a strong version of the signal. The 10-day average of net new highs is -108, worse than 92% of past signal days. MOVE is near its high of the year. Spreads are milder than in most past signals.
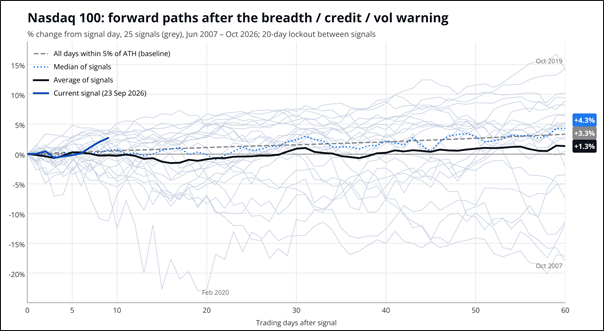
NASDAQ looks similar, naturally…
S&P correction odds after and without signal.
And one last chart to show all the results, one by one.
Conveniently, this analysis comes after a rather epic rally in QQQ, and at a time when bitcoin, silver, and gold all finally trade weak. The strength in crypto in the past week or two has made it particularly tough for me to have a bearish equity view because it indicated to me that animal spirits were still alive. Now, with the break to the ATH in stonks, tightening financial conditions, a zippy move in bonds today, this backtest, weakness in crypto, and a stellar entry point… I think this is a great time to take a shot selling QQQ. I am adding it to the sidebar.
Short at 754 with a stop 2 ATRs away at 772.55. Take profit 708.55. Risk 19 to make 45.
Not investment advice. Simply sharing my ideas. Trade your own view. Regular readers know how I roll when it comes to shorting equity indexes. I am not a permabear. I will sell here and if I get stopped out, I will move on to the next idea. I have no emotional attachment. I just think this is a great place to take a shot. Thanks to Jonathan Krinsky for taking the time to email. His points helped greatly.
Currencies
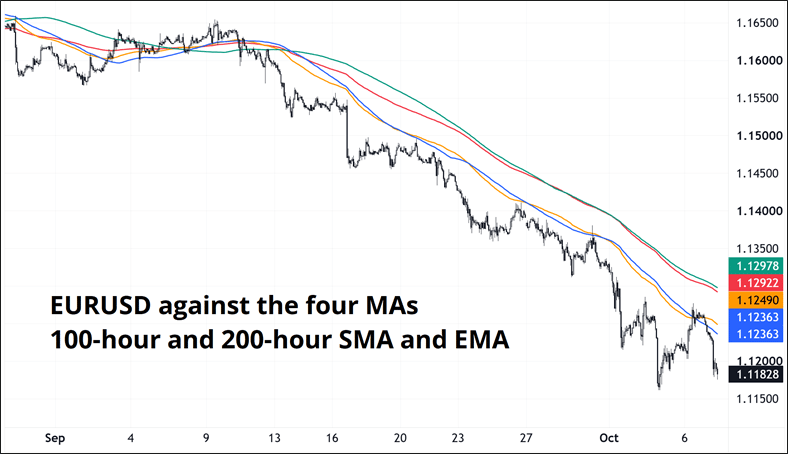
EURUSD did the perfect test of 1.1270/20 and is trading exactly as you’d hope would if you are short. GBPUSD joining the party now too. The old daily levels which I have been discussing in here for ages were 1.1270/1.1320 and the high yesterday was 1.1277 so that’s a perfect weak retest and fail. Look at the price vs. the moving averages. That’s a trend! With positioning quite long USD, I still think we could see more choppy moves in EURUSD and EURCHF with a bias lower. French spreads haven’t widened enough yet today to justify new lows in the euro.
Author

Brent Donnelly
Spectra Markets
Brent Donnelly is the President of Spectra Markets. He has been trading currencies since 1995 and writing about macro since 2004. Brent is the author of “Alpha Trader” (2021) and “The Art of Currency Trading” (Wiley, 2019).