Stocks Extend Their Fluctuations, Topping Pattern Or Just Consolidation Before Another Leg Up?

Briefly: In our opinion, speculative short positions are favored (with stop-loss at 2,210, and profit target at 2,050, S&P 500 index).
Our intraday outlook is bearish, and our short-term outlook is bearish. Our medium-term outlook is neutral, following S&P 500 index breakout above last year's all-time high:
Intraday outlook (next 24 hours): bearish
Short-term outlook (next 1-2 weeks): bearish
Medium-term outlook (next 1-3 months): neutral
Long-term outlook (next year): neutral
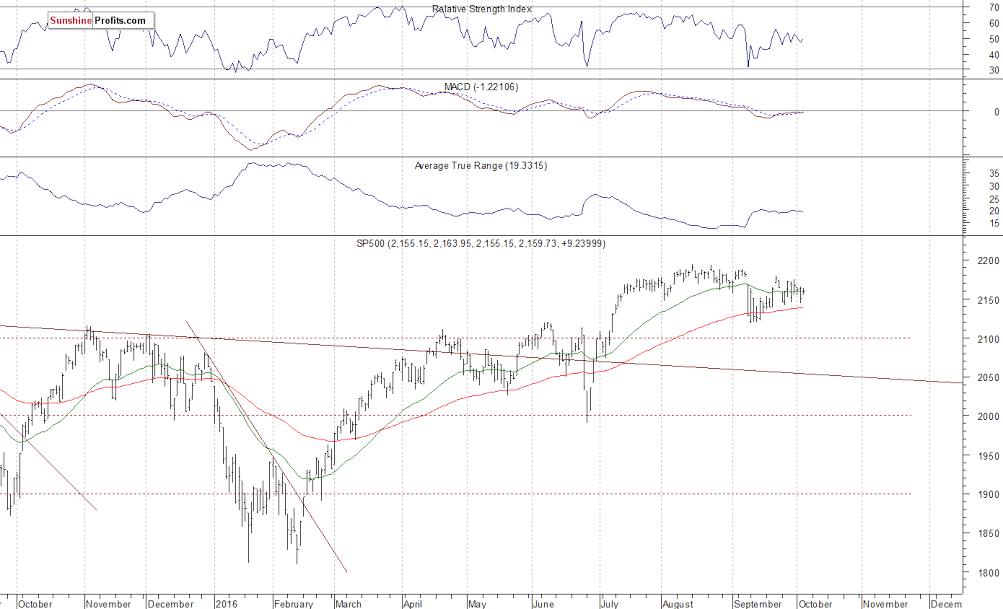
The main U.S. stock market indexes gained between 0.4% and 0.6% on Wednesday, extending their short-term fluctuations, as investors reacted to better-than-expected economic data releases. The S&P 500 index trades along its July - August consolidation, following the early September decline. The nearest important level of resistance is at around 2,170-2.180, marked by recent local high. On the other hand, support level is at around 2,140-2,150, marked by some local lows. The next important support level remains at 2,120. The market trades within a correction following recent rally. Will it continue its uptrend? Or is this some topping pattern before downward reversal?
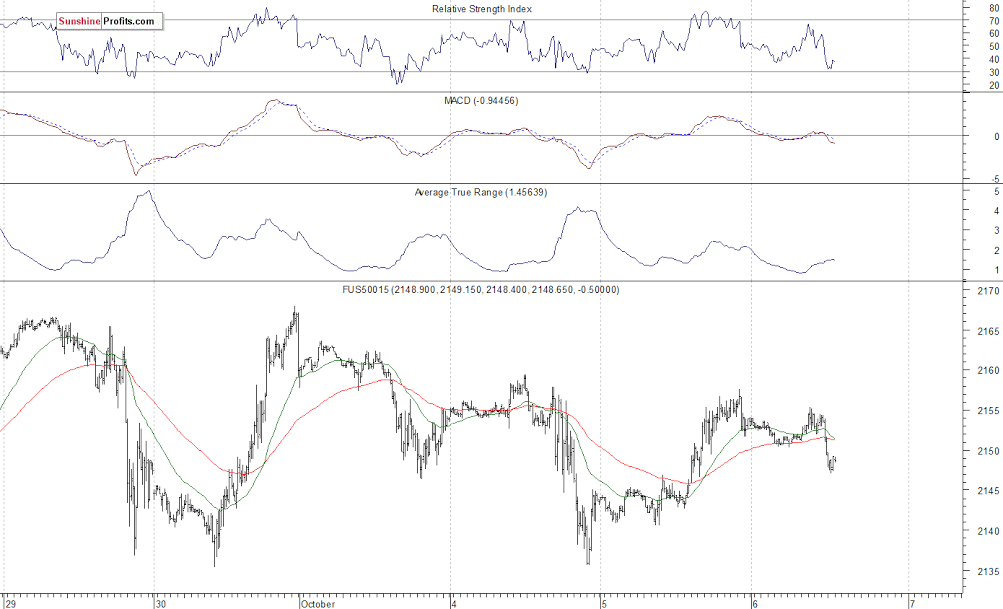
Expectations before the opening of today's trading session are slightly negative, with index futures currently down 0.1-0.2%. The European stock market indexes have lost 0.1-0.4% so far. Investors will now wait for the Initial Claims number release at 8:30 a.m. The S&P 500 futures contract trades within an intraday downtrend, as it retraces some of its yesterday's move up. The nearest important level of resistance is at around 2,155-2,160, marked by recent local highs. On the other hand, support level remains at 2,130-2,140, among others, as we can see on the 15-minute chart:
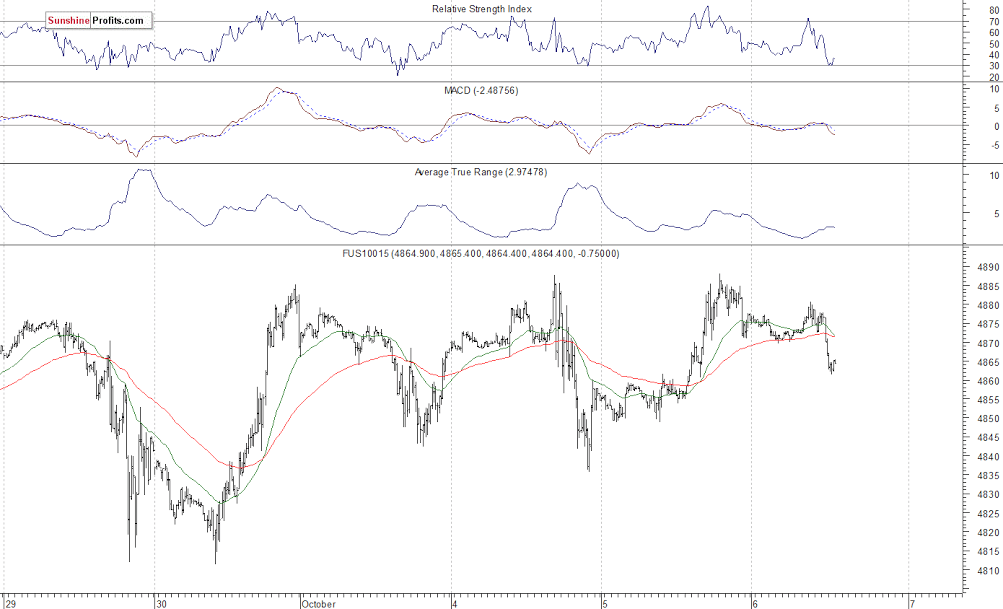
The technology Nasdaq 100 futures contract is relatively stronger than the broad stock market, as it remains close to all-time high. It trades within an intraday downtrend, following yesterday's advance. The nearest important resistance level is at 4,870-4,890, marked by local highs. On the other hand, support level remains at 4,830-4,840, and the next support level is at around 4,800, as the 15-minute chart shows:
Concluding, the broad stock market extended its short-term fluctuations yesterday, as the S&P 500 index retraced most of its Tuesday's move down. It still looks like a medium-term topping pattern. Therefore, we continue to maintain our speculative short position (opened on July 18th at 2,162, S&P 500 index). Stop-loss level is at 2,210 and potential profit target is at 2,050 (S&P 500 index). You can trade S&P 500 index using futures contracts (S&P 500 futures contract - SP, E-mini S&P 500 futures contract - ES) or an ETF like the SPDR S&P 500 ETF - SPY. It is always important to set some exit price level in case some events cause the price to move in the unlikely direction. Having safety measures in place helps limit potential losses while letting the gains grow.
Want free follow-ups to the above article and details not available to 99%+ investors? Sign up to our free newsletter today!
Author

Paul Rejczak
Sunshine Profits
Paul Rejczak is a stock market strategist who has been known for the quality of his technical and fundamental analysis since the late nineties.


