|

SP500 trade review with sign of strength rally breakout strategy [Video]

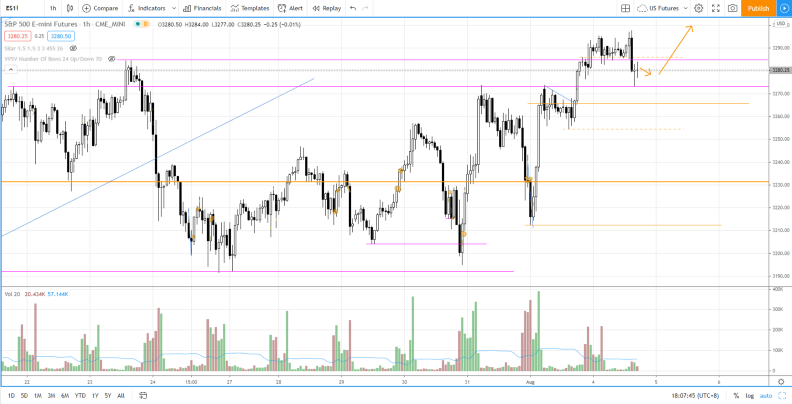
Yesterday S&P 500 futures (ES) formed a beautiful Wyckoff structure during the non-regular trading hours (RTH). It sprang the previous swing low followed by a minor sign of strength rally and a test before breaking out of the down-sloping structure.

Check out the video for a complete walk through of the daily market analysis of S&P 500 futures (ES) for 4 Aug 2020 trading session. In this video, I am going to show you the market recap on the last session, plus one trade review in the three-minutes timeframe (including entry, exit and the rationale behind). Going forward, I will cover the bias, the key levels to pay attention to, the potential setup for the US session later.

Check out my daily market analysis video yesterday if you haven’t in order to better relate to the market recap and the trade review.

Bias — bullish (Day trading); bullish (long term)

Key levels — Resistance: 3300, 3310–3340; Support: 3273, 3230, 3190, 3170–3180, 3105

Potential setup — Look for potential reversal setup near the key support and resistance levels.

SP500

Author

Ming Jong Tey

Ming Jong Tey

Independent Analyst

Ming Jong Tey has been trading since 2008. He started his learning journey from technical analysis (indicators, Fibonacci, etc...) to value investing. Throughout his journey, he develops an interest in price action with chart pattern trading.

More from Ming Jong Tey
Share:

Editor's Picks

EUR/USD flirts with weekly lows near 1.1770

EUR/USD now comes under further selling pressure, breaking below the 1.1800 support to challenge the area of weekly throughs near 1.1770 on Thursday. The pair’s decline comes in response to marked gains in the US Dollar amid steady geopolitical tensions. Ealier in the day, the ECB’s Lagarde delivered cautious remarks, although the currency remained apathetic.

GBP/USD threatens the 200-day SMA near 1.3440

GBP/USD rapidly leaves behind Wednesday’s strong advance, coming under heavy pressure and retesting the 1.3440 zone, where the critical 200-day SMA is located. Cable’s deep pullback follows the strong gains in the Greenback, while investors continue to pencil in a potential BoE rate cut in March.

Gold trims gains, slips back to around $5,170

Gold is now facing some downside pressure, hovering around the $5,170 region on Thursday. The yellow metal surrenders part of its earlier gains on the back of the resurgence of the buying interest in the Greenback. In the meantime, geopolitical tensions in the Middle East continue to limit the downside potential for now.

Stellar: Relief bounce fades as bearish undertone persists

Stellar is trading around $0.16 at the time of writing on Thursday after rebounding more than 8% in the previous day. Derivatives data paints a negative picture as XLM’s short bets hit a monthly high while Open Interest continues to decline.

Changing the game: International implications of recent tariff developments

The Supreme Court ruling on International Emergency Economic Powers Act (IEEPA) tariffs provides limited relief for the rest of the world, with weighted average tariff rates modestly lower.

Bitcoin steadies as traders eye US–Iran talks

Bitcoin (BTC) price is stabilizing around $68,000 at the time of writing on Thursday after a 6.2% relief rally the previous day amid a broader downward trend.