Good chance for the S&P 500 to trend lower for the next days

10/12 Recap: - The S&P opened with a 7 handle gap up and then continued 7 handle higher into a 9:34 AM high of the day. From that high, the S&P quickly dropped 25 handles into a 9:42 AM low. The S&P quickly rebounded 18 handles into a 9;52 AM high. From that high, the S&P declined 15 handles into a 10:17 AM low. From that low, the S&P traded in an 11 handle range with an upward bias, culminating with a pullback low at 11:45 AM. From that low, the S&P rallied 17 handles into a 12;09 PM high. From that high, the S&P declined 22 handles into a 1:25 PM low. From that low, the S&P rallied 17 handles into a 2:19 PM high. From that high, the S&P declined 27 handles into a 3:47 PM low of the day. From that low, the S&P bounced 9 handles into the close.
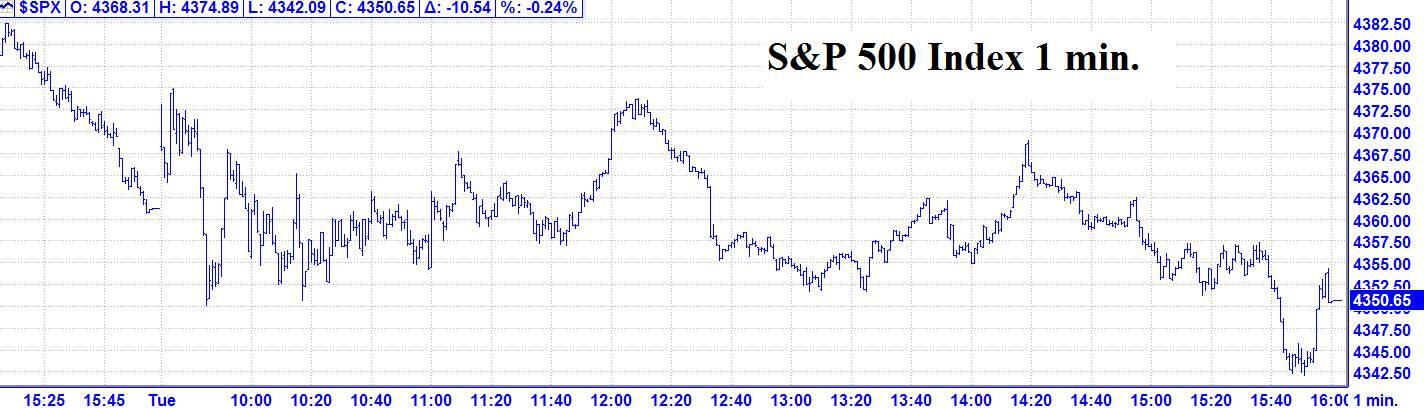
10//12 - The major indices had a small down day with the following closes: The DJIA – 117.72; S&P 500 – 10.54; and the Nasdaq Composite – 20.28.
Looking ahead – Looking ahead, we don’t have any major change in trend points until 10/14. That means there is a good chance for the S&P to trend lower for the next 1 - 2 days.
The NOW Index is in the NEUTRAL ZONE.
Coming events
(Stocks potentially respond to all events).
2. C. 10/14 AC – Mercury 0 North Latitude. Major change in trend Corn, Oats, Soybeans, Wheat.
D. 10/15 AC - Neptune 90 US Mars. Major change in trend US Stocks, T-Bonds, US Dollar.
E. 10/15 AC – Jupiter in Aquarius turns Direct. Major change in trend Copper and Oats.
Stock market key dates
Fibonacci – 10/15, 10/18, 10/29.
Astro –10/14, 10/15, 10/20, 10/25, 10/29 AC.
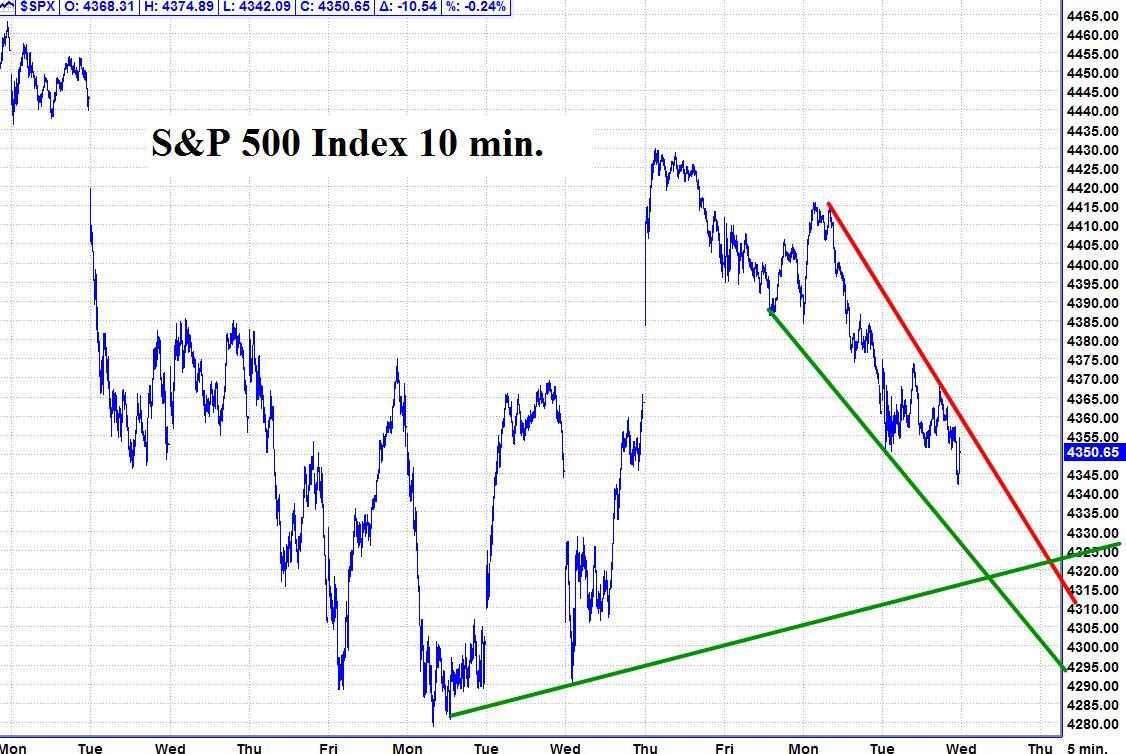
Please see below the S&P 500 10 minute chart.
Support - 4320 Resistance – 4360, 4400.
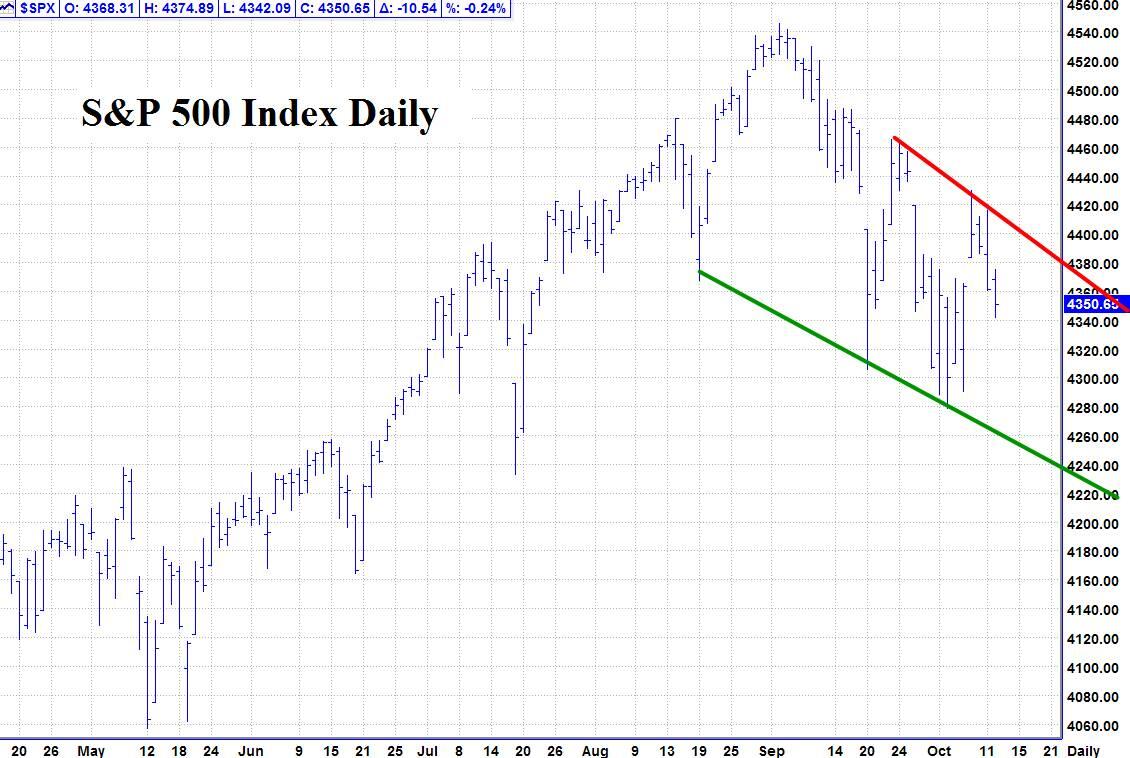
Please see below the S&P 500 Daily chart.
Support - 4320, 4260 Resistance – 4400.
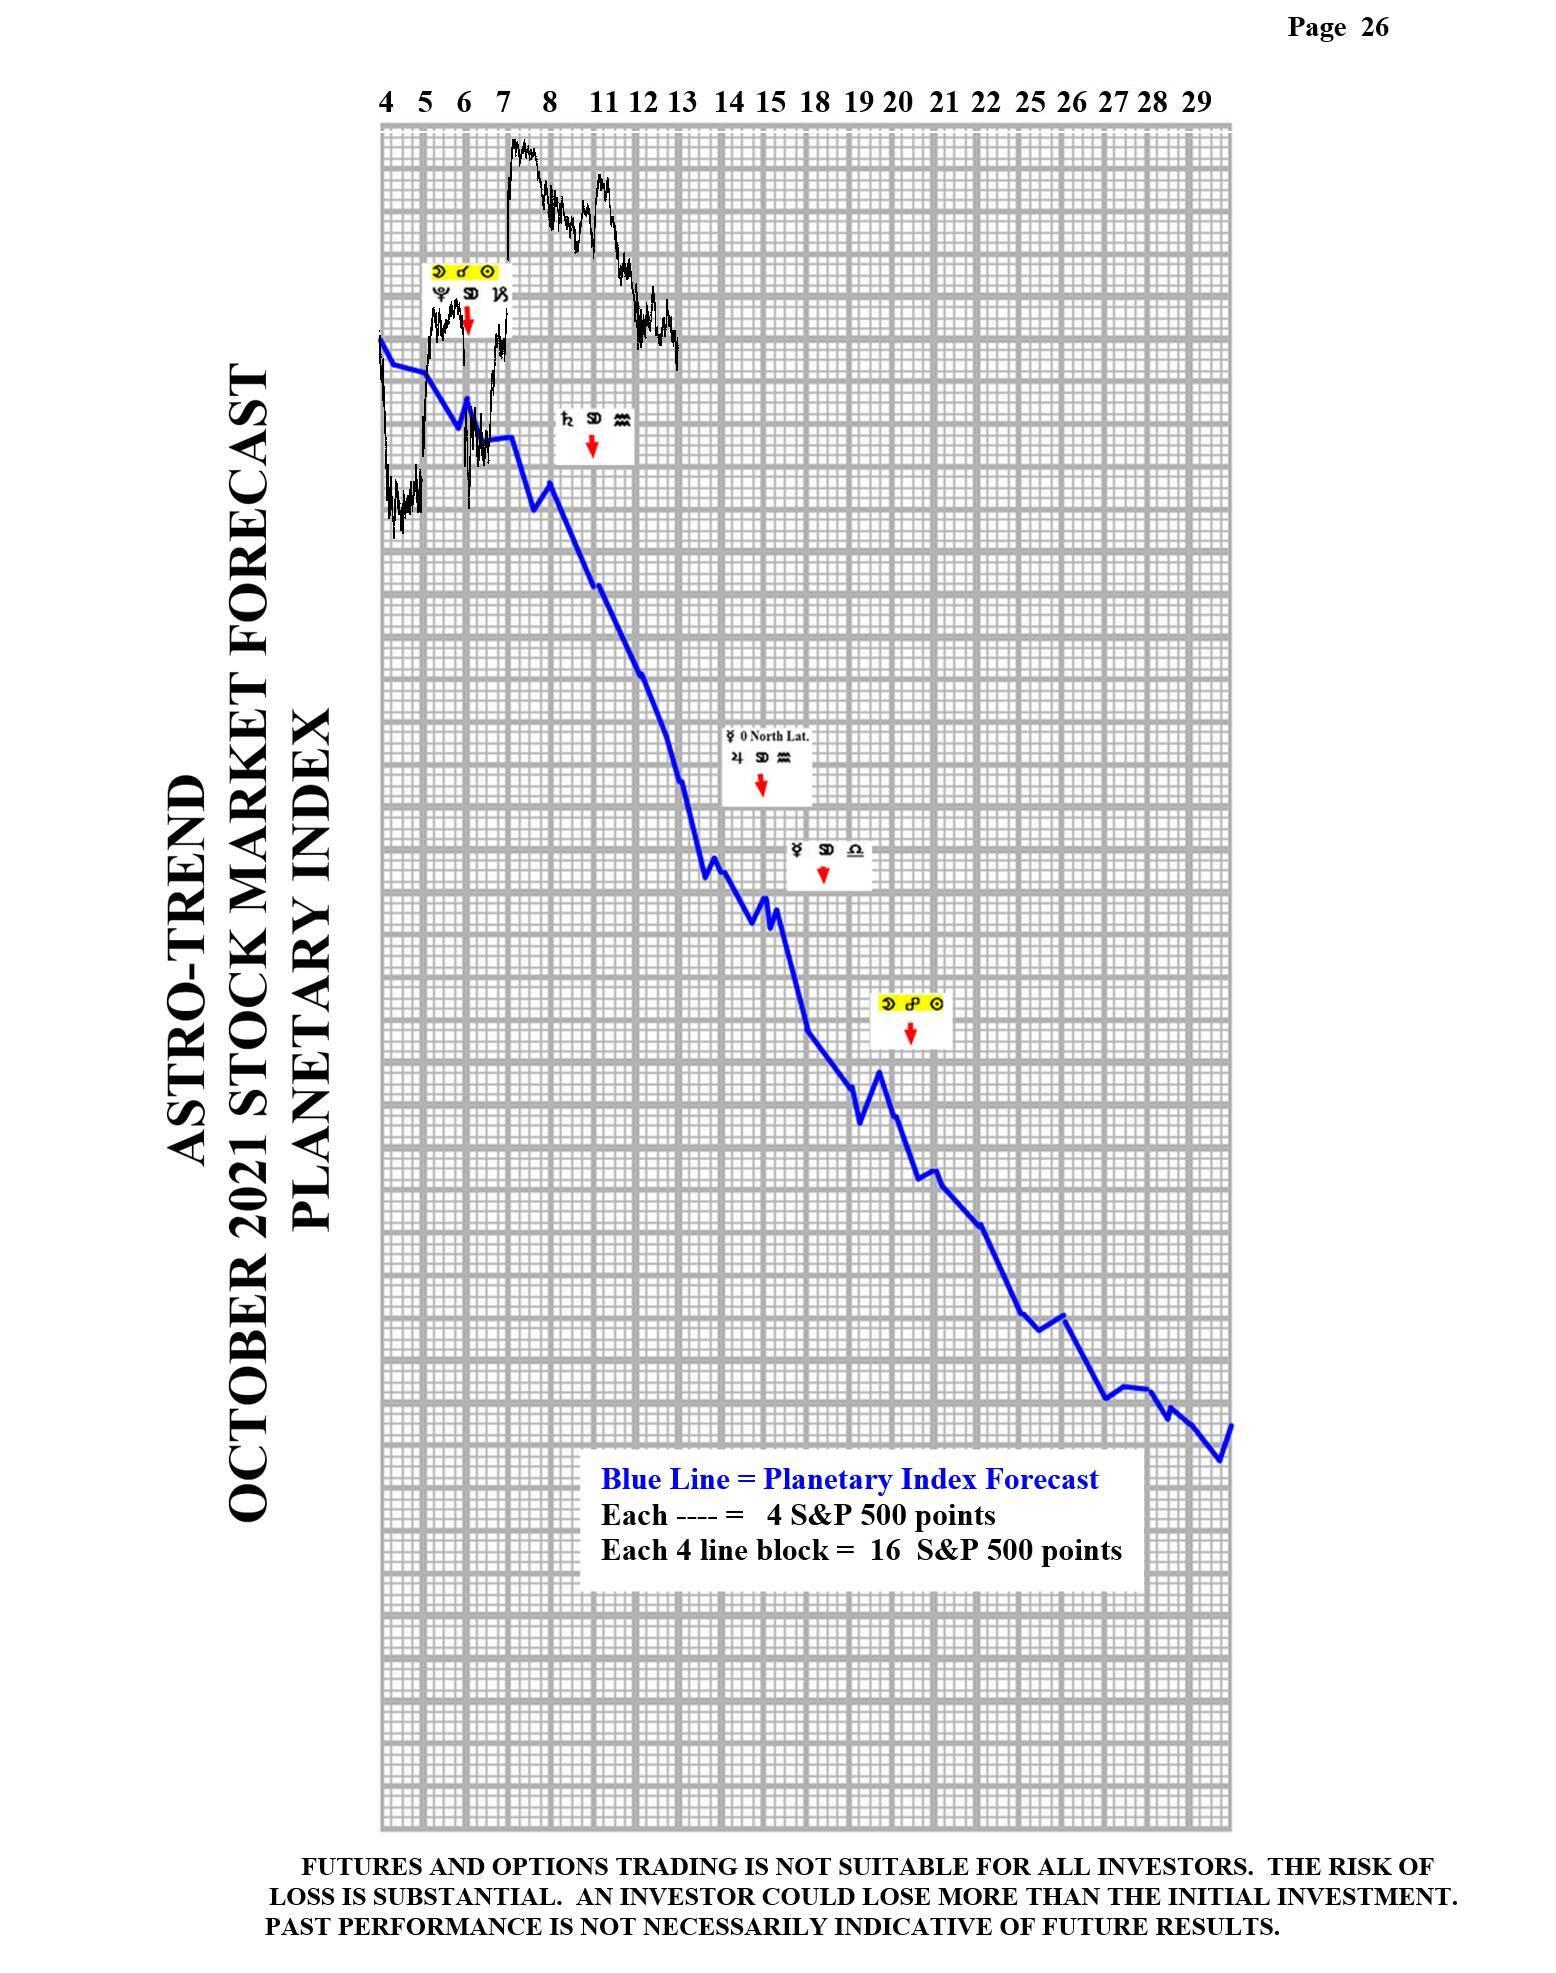
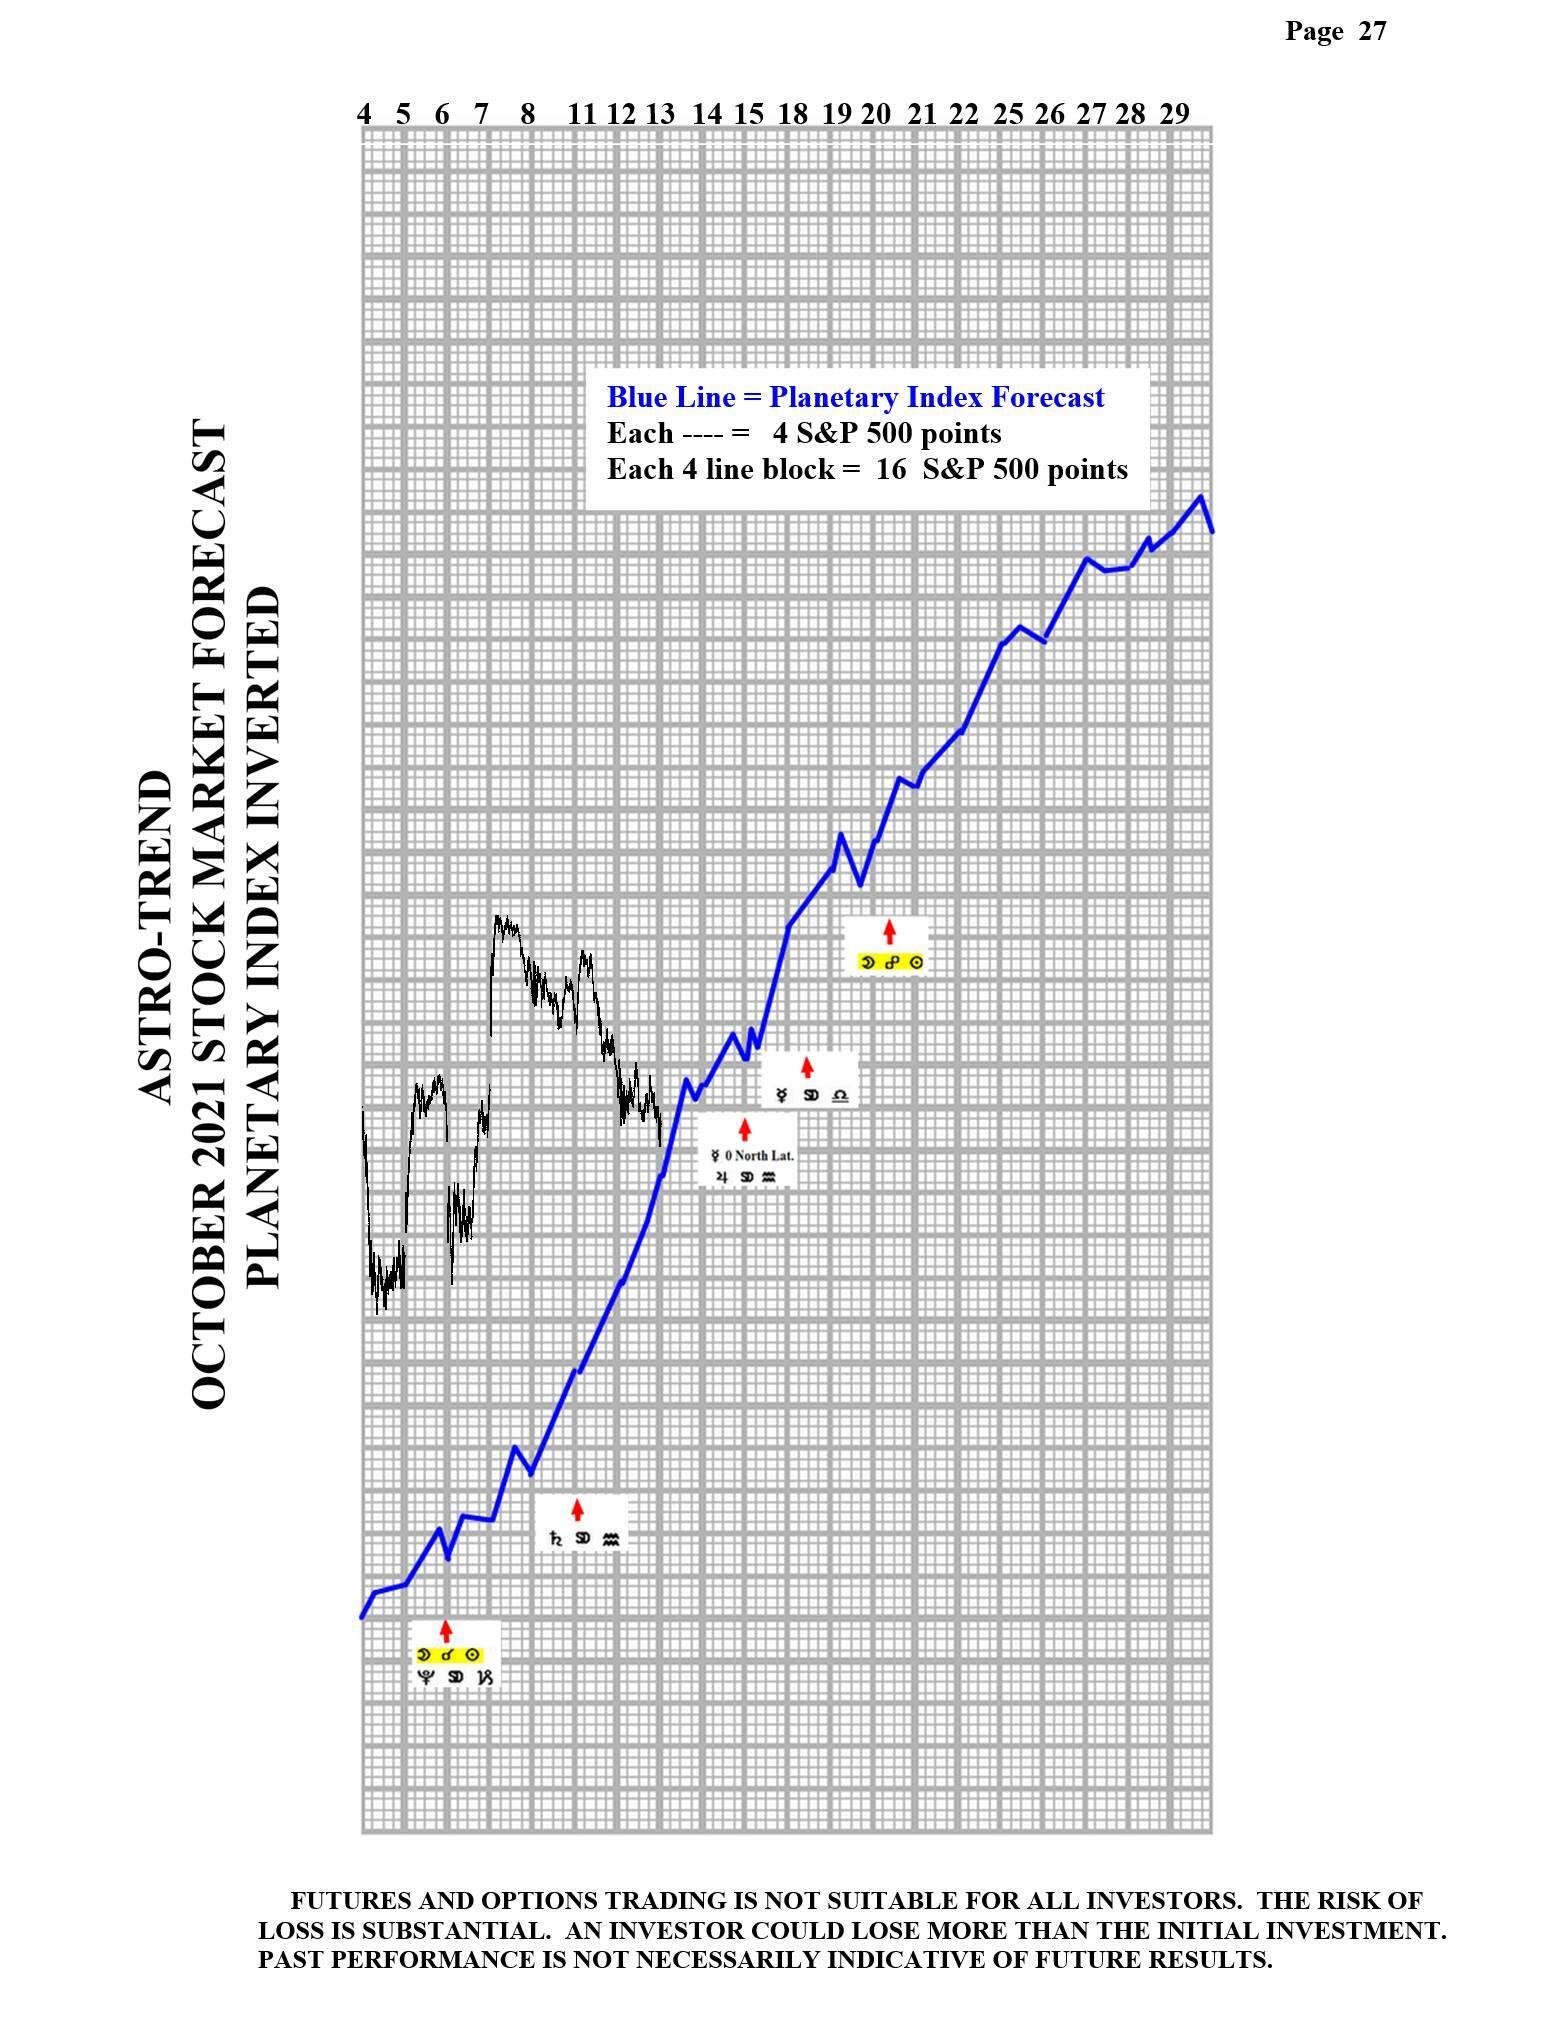
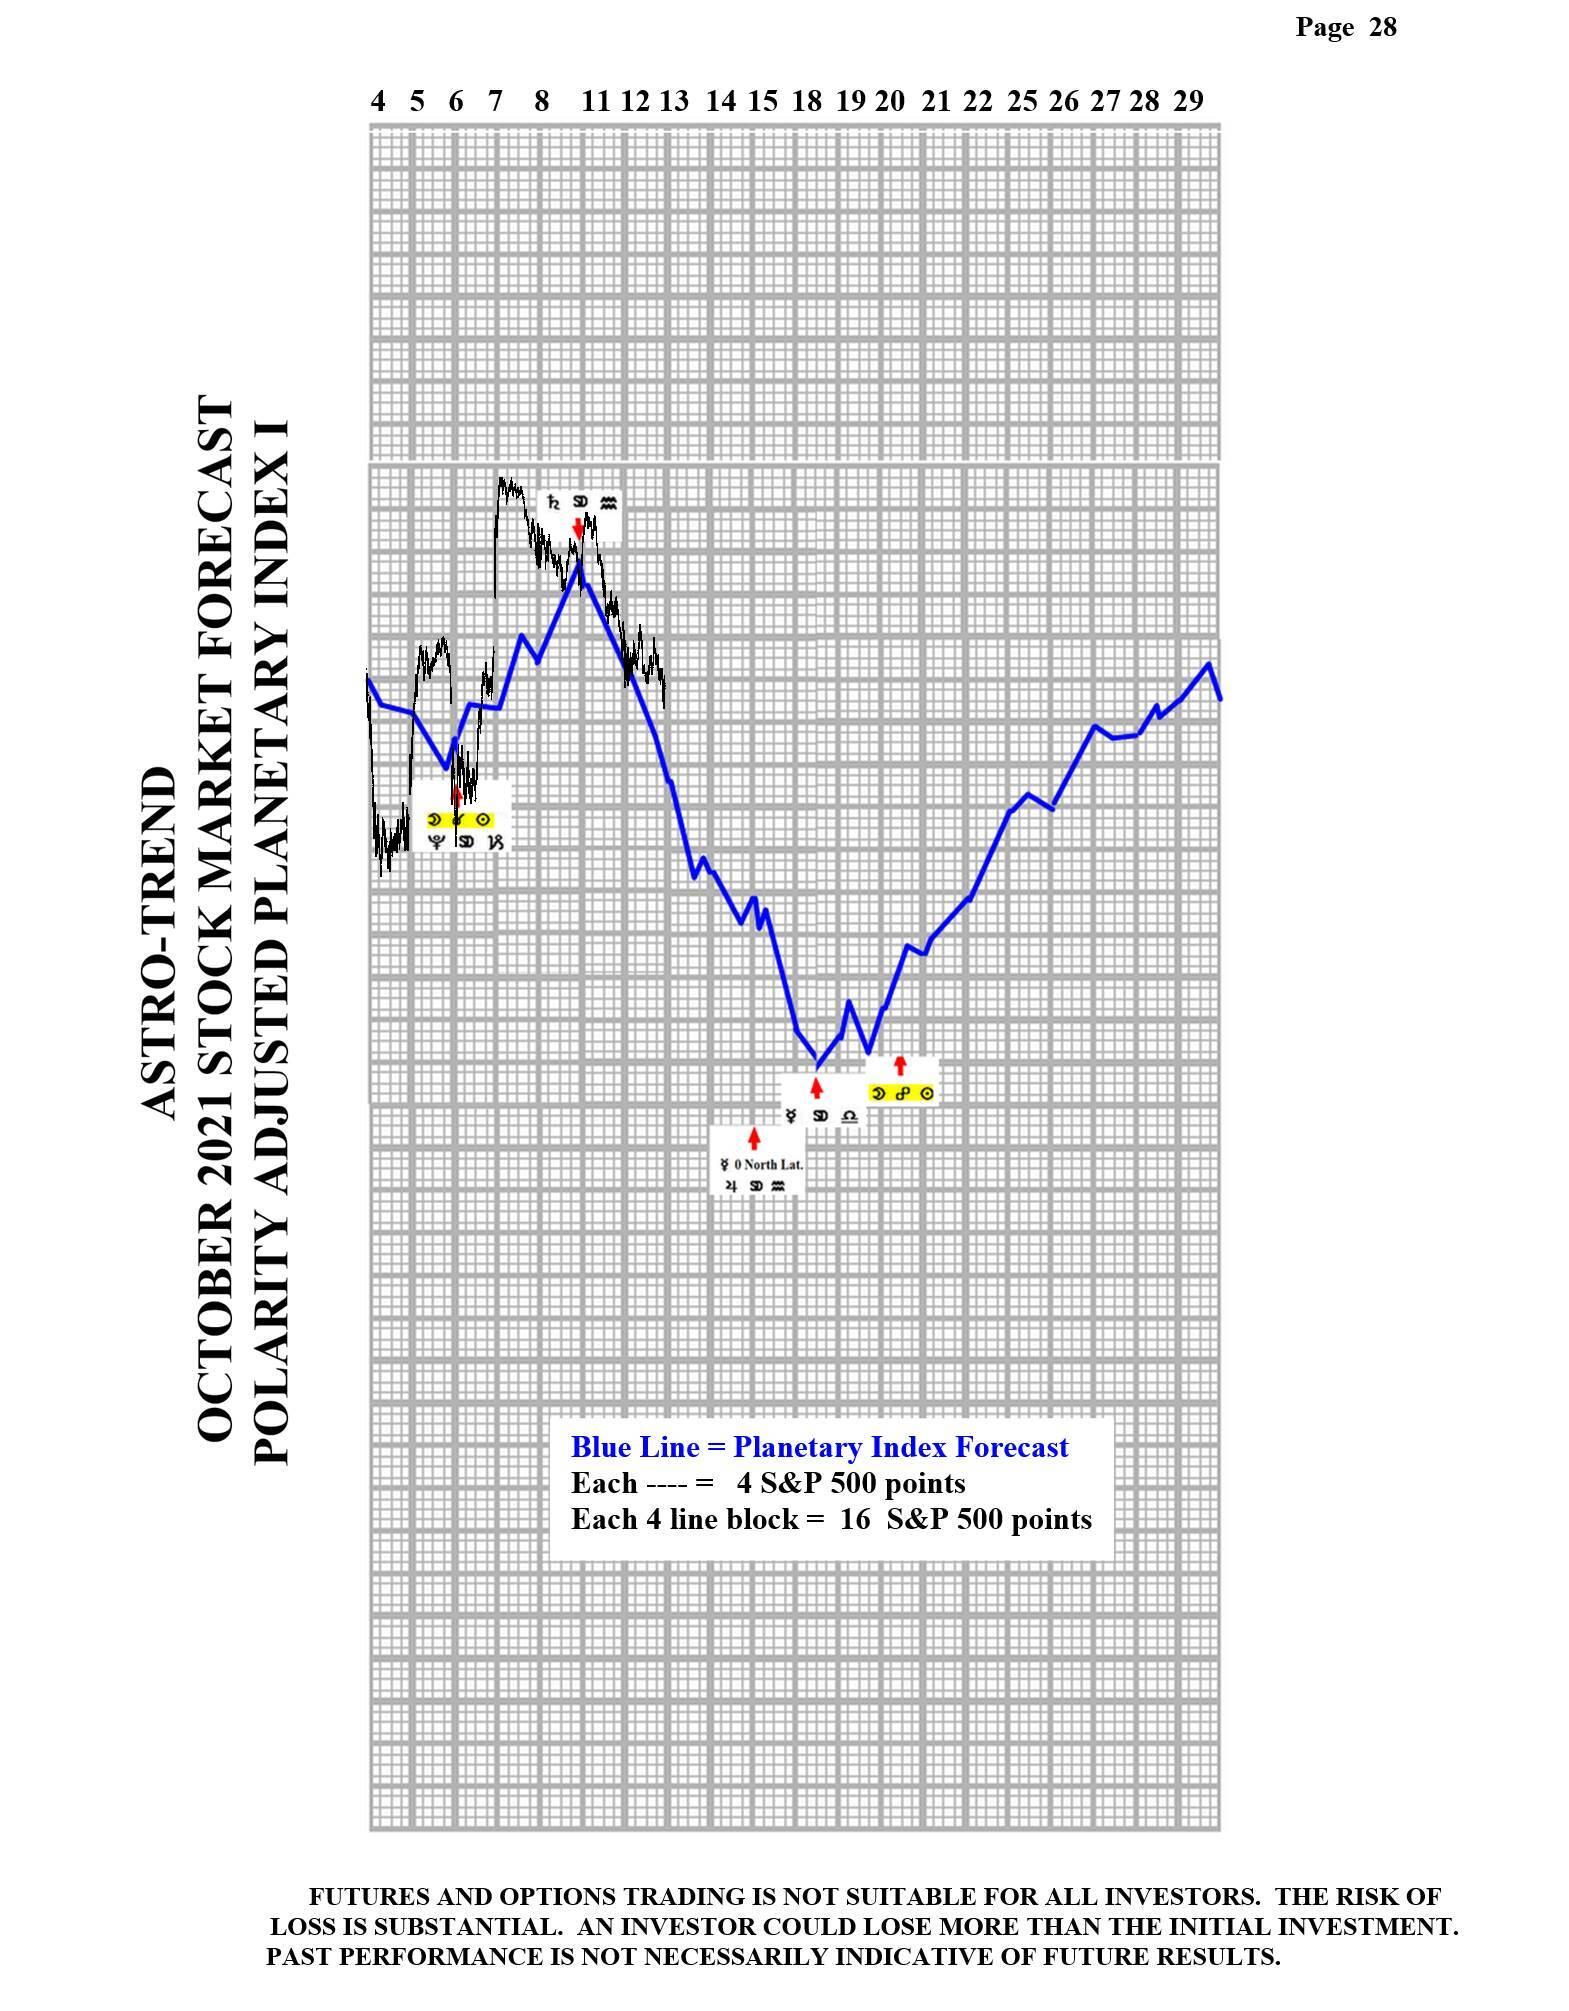
Please see below the Planetary Index charts with S&P 500 5 minute bars for results.

Author

Norm Winski
Independent Analyst
www.astro-trend.com


