S&P 500: Negative Expectations Again

Stocks were gaining on Friday following a lower opening of the trading session and the morning sell-off. The S&P 500 index extended its downtrend before bouncing off and closing 0.4% higher. So was it an upward reversal or just correction within a downtrend?
S&P 500: Negative Expectations Again
The U.S. stock market indexes gained 0.1-0.4% on Friday, after bouncing off their new lows as investors' sentiment improved despite an ongoing trade war. The S&P 500 index retraced the whole of its April's advance. It currently trades 2.4% below its May the 1st record high of 2,954.13. The Dow Jones Industrial Average gained 0.4% and the Nasdaq Composite gained 0.1% on Friday.
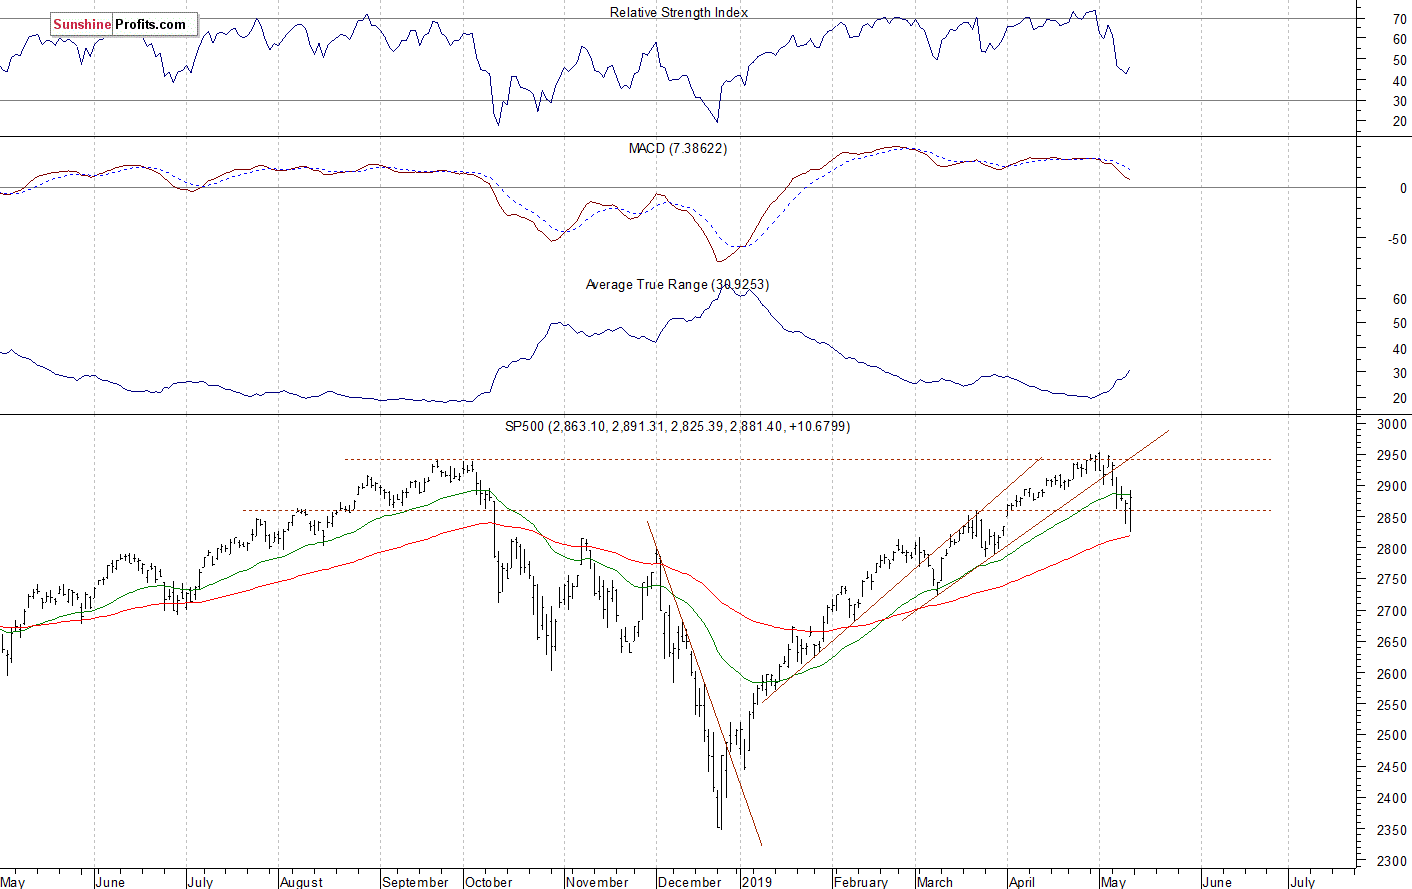
The nearest important resistance level of the S&P 500 index is at 2,890-2,900, marked by the previous support level. The resistance level is also at 2,920. On the other hand, the support level is at 2,860-2,865. The support level is also at around 2,835-2,850, marked by April the 1st daily gap up of 2,836.03-2,848.63.
The broad stock market retraced all of its December sell-off and it broke above the last year's high recently. But then the index broke below the short-term consolidation and it retraced all of the April's advance. The market also broke below its two-month-long upward trend line, as we can see on the daily chart:
Negative Expectations Again
Expectations before the opening of today's trading session are negative, because the index futures contracts trade 1.2-1.7% below their Friday's closing prices. The European stock market indexes have lost 0.1-0.6% so far. There will be no new important economic data releases today.
The broad stock market will likely come back to its short-term lows following Friday's intraday bounce. The index broke below the support level of around 2,890-2,900 recently, and then we saw more selling pressure. The market was below the relatively important support level of 2,850 on Friday, but then it came back higher again. However, there have been no confirmed positive signals so far.
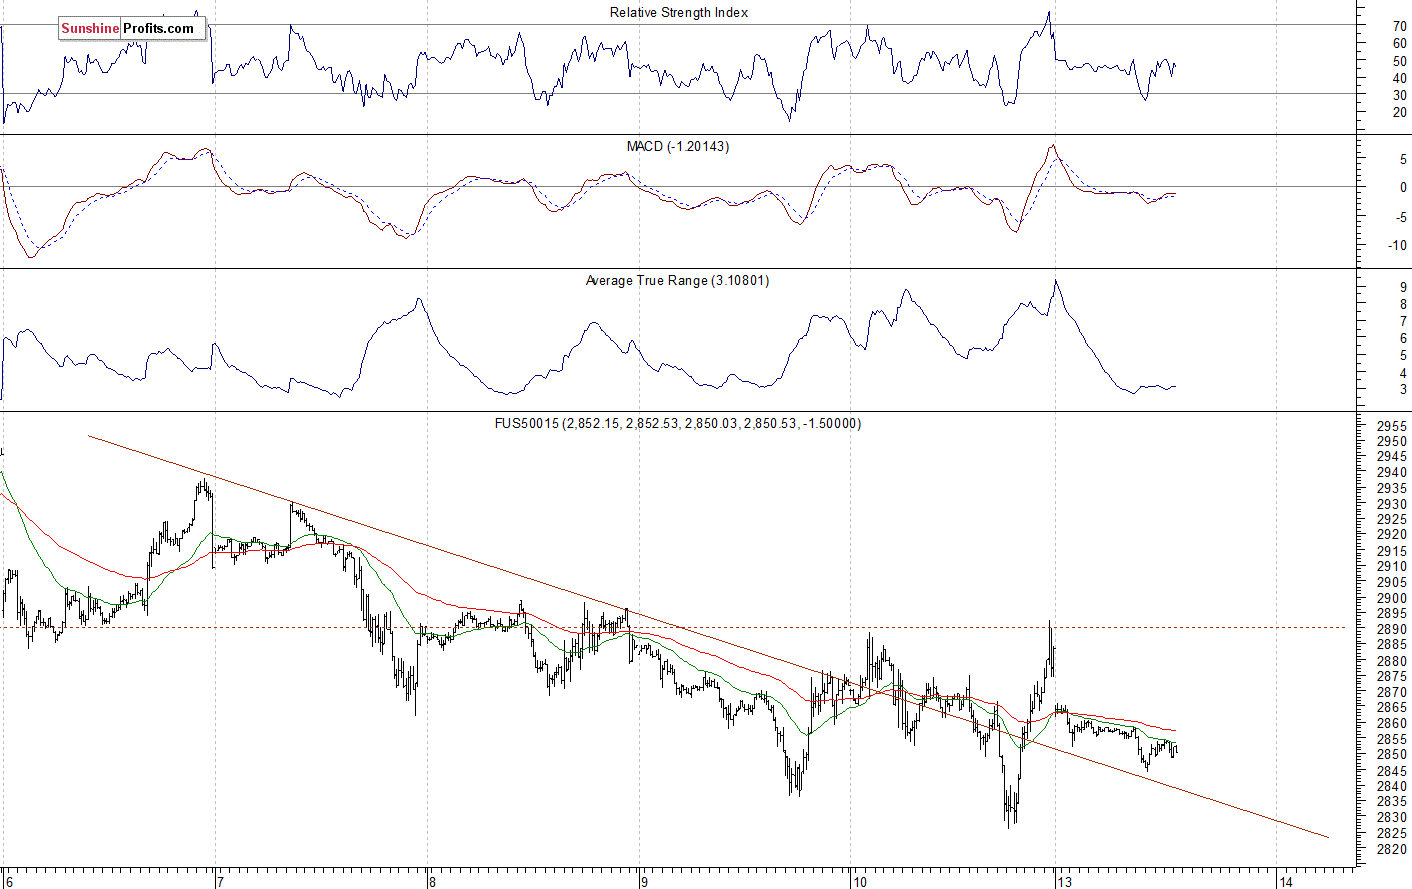
The S&P 500 futures contract trades within an intraday consolidation following an overgnight sell-off. The nearest important level of resistance is at around 2,860-2,865. On the other hand, the support level is at 2,825-2,830. The futures contract remains within a short-term consolidation, as the 15-minute chart shows:
Nasdaq Also Lower
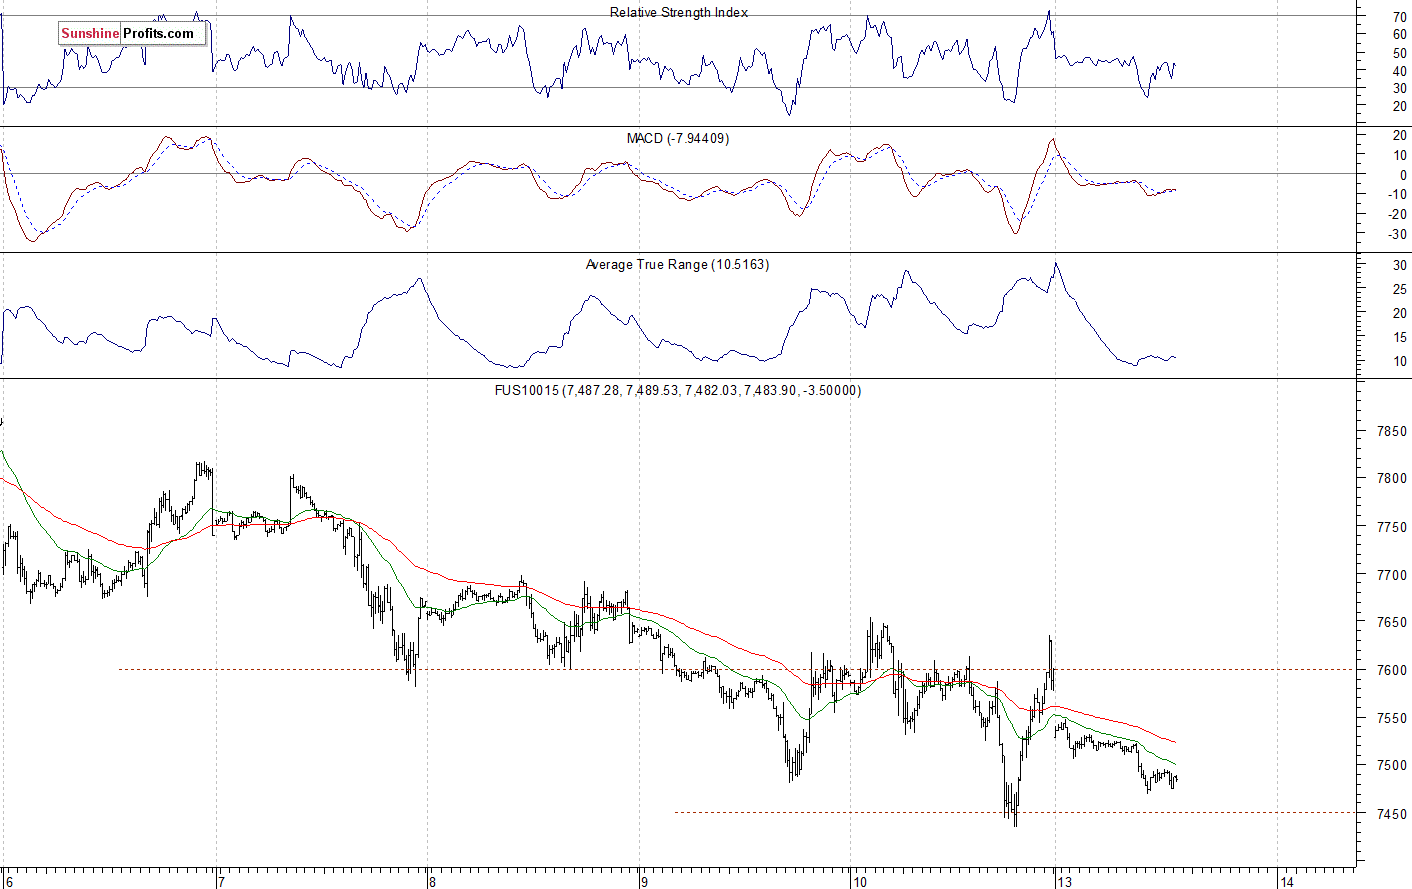
The technology Nasdaq 100 futures contract follows a similar path, as it trades within an intraday consolidation following overnight decline. The nearest important resistance level is at 7,500-7,550. On the other hand, the support level is at around 7,450. The Nasdaq futures contract is slightly above its Friday's local low this morning, as we can see on the 15-minute chart:
Tech Stocks – New Downtrend or Just Correction?
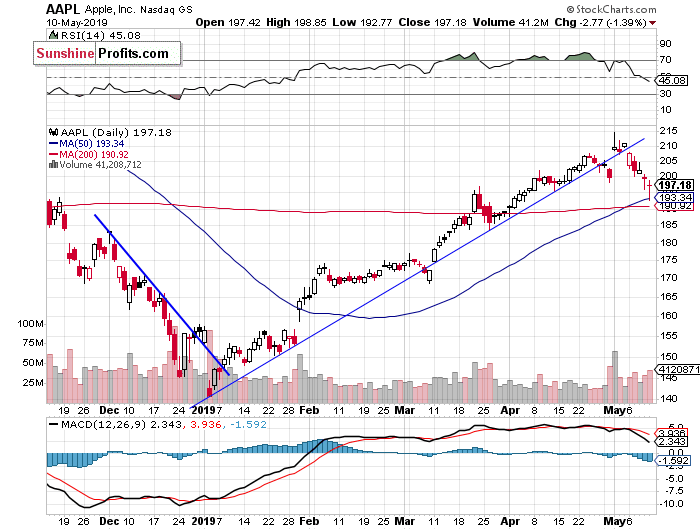
Let's take a look at the Apple, Inc. stock (AAPL) daily chart. The stock extended its rally on May the 1st following the quarterly earnings release. Then the price reversed its upward course and broke below its medium-term upward trend line. For now, it looks like a downward correction. However, if the market breaks below the support level of $190-195, we could see more selling pressure:
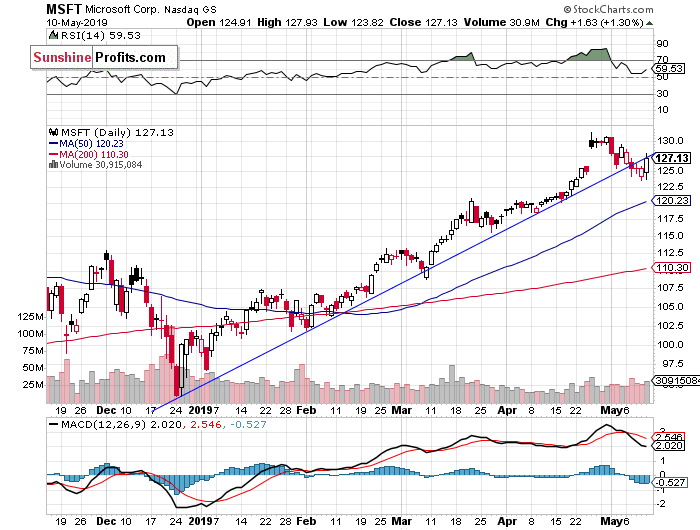
Now let's take a look at the daily chart of Microsoft Corp. (MSFT). The stock accelerated its uptrend in the late April, as it reached the new record high of $131.37. Investors reacted to a better-than-expected quarterly earnings release. But it looked like a blow-off topping pattern. And we wrote about some clear technical overbought conditions. Since then, the market is trading within a downward correction. It remains above the support level of $120- 125:
Dow Jones – Medium-Term Consolidation
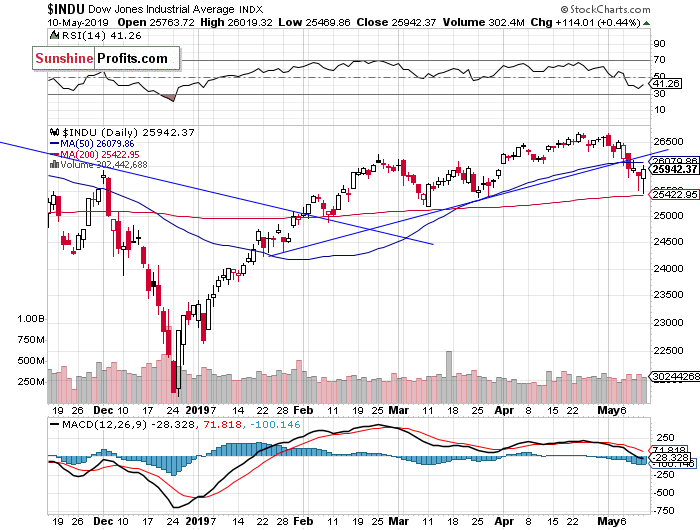
The Dow Jones Industrial Average was relatively weaker than the broad stock market since February. The resistance level remains at around 26,800-27,000, marked by the last year's topping pattern and the record high of 26,951.8. But for now, the market trades below 26,000 mark following breaking down below the medium-term upward trend line:
Nikkei Below its Upward Trend Line
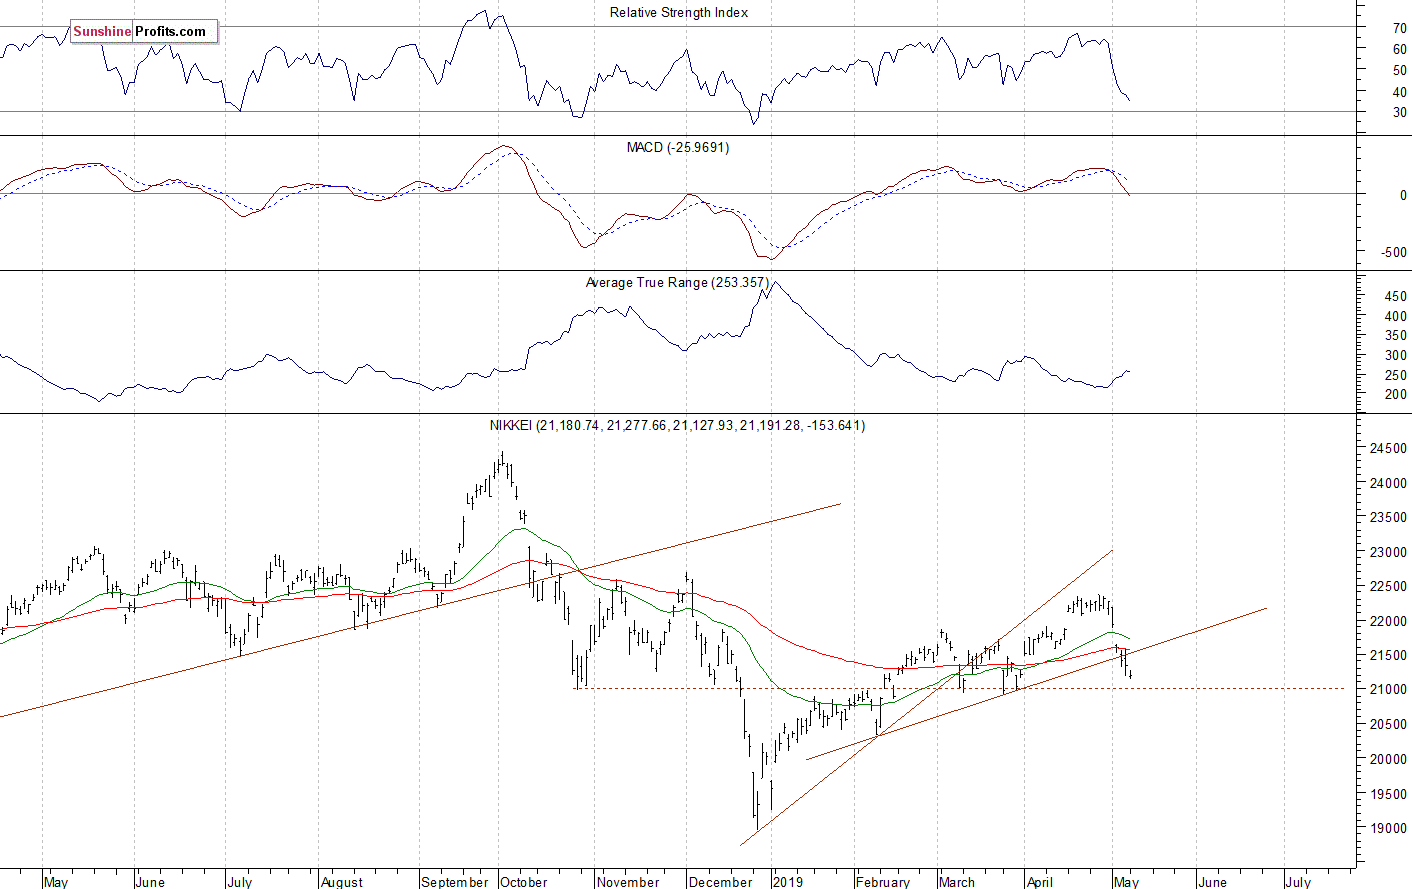
Let's take a look at the Japanese Nikkei 225 index. It accelerated the downtrend in late December, as it fell slightly below the 19,000 level. Then it was retracing the downtrend for several months. But recently the market broke below its three-month-long upward trend line. And we may see some more medium-term sideways trading action along the 21,000 mark:
The S&P 500 index has reached the new record high recently. The broad stock market extended its medium-term uptrend, as investors' sentiment remained very bullish following economic data, quarterly corporate earnings releases. However, last week it retraced its April's advance following the renewed trade war fears. On Thursday and on Friday it sold off below the 2,850 mark, before reversing higher and closing above that support level. We may see more short-term volatility today.
Concluding, the S&P 500 index will likely open lower today. Then the market may fluctuate along its recent local lows.
Want free follow-ups to the above article and details not available to 99%+ investors? Sign up to our free newsletter today!
Author

Paul Rejczak
Gold Price Forecast
Paul Rejczak is a stock market strategist who has been known for the quality of his technical and fundamental analysis since the late nineties.


