S&P 500 bound for deeper waters?

All three longer-term technical timeframes point to further underperformance in the S&P 500.
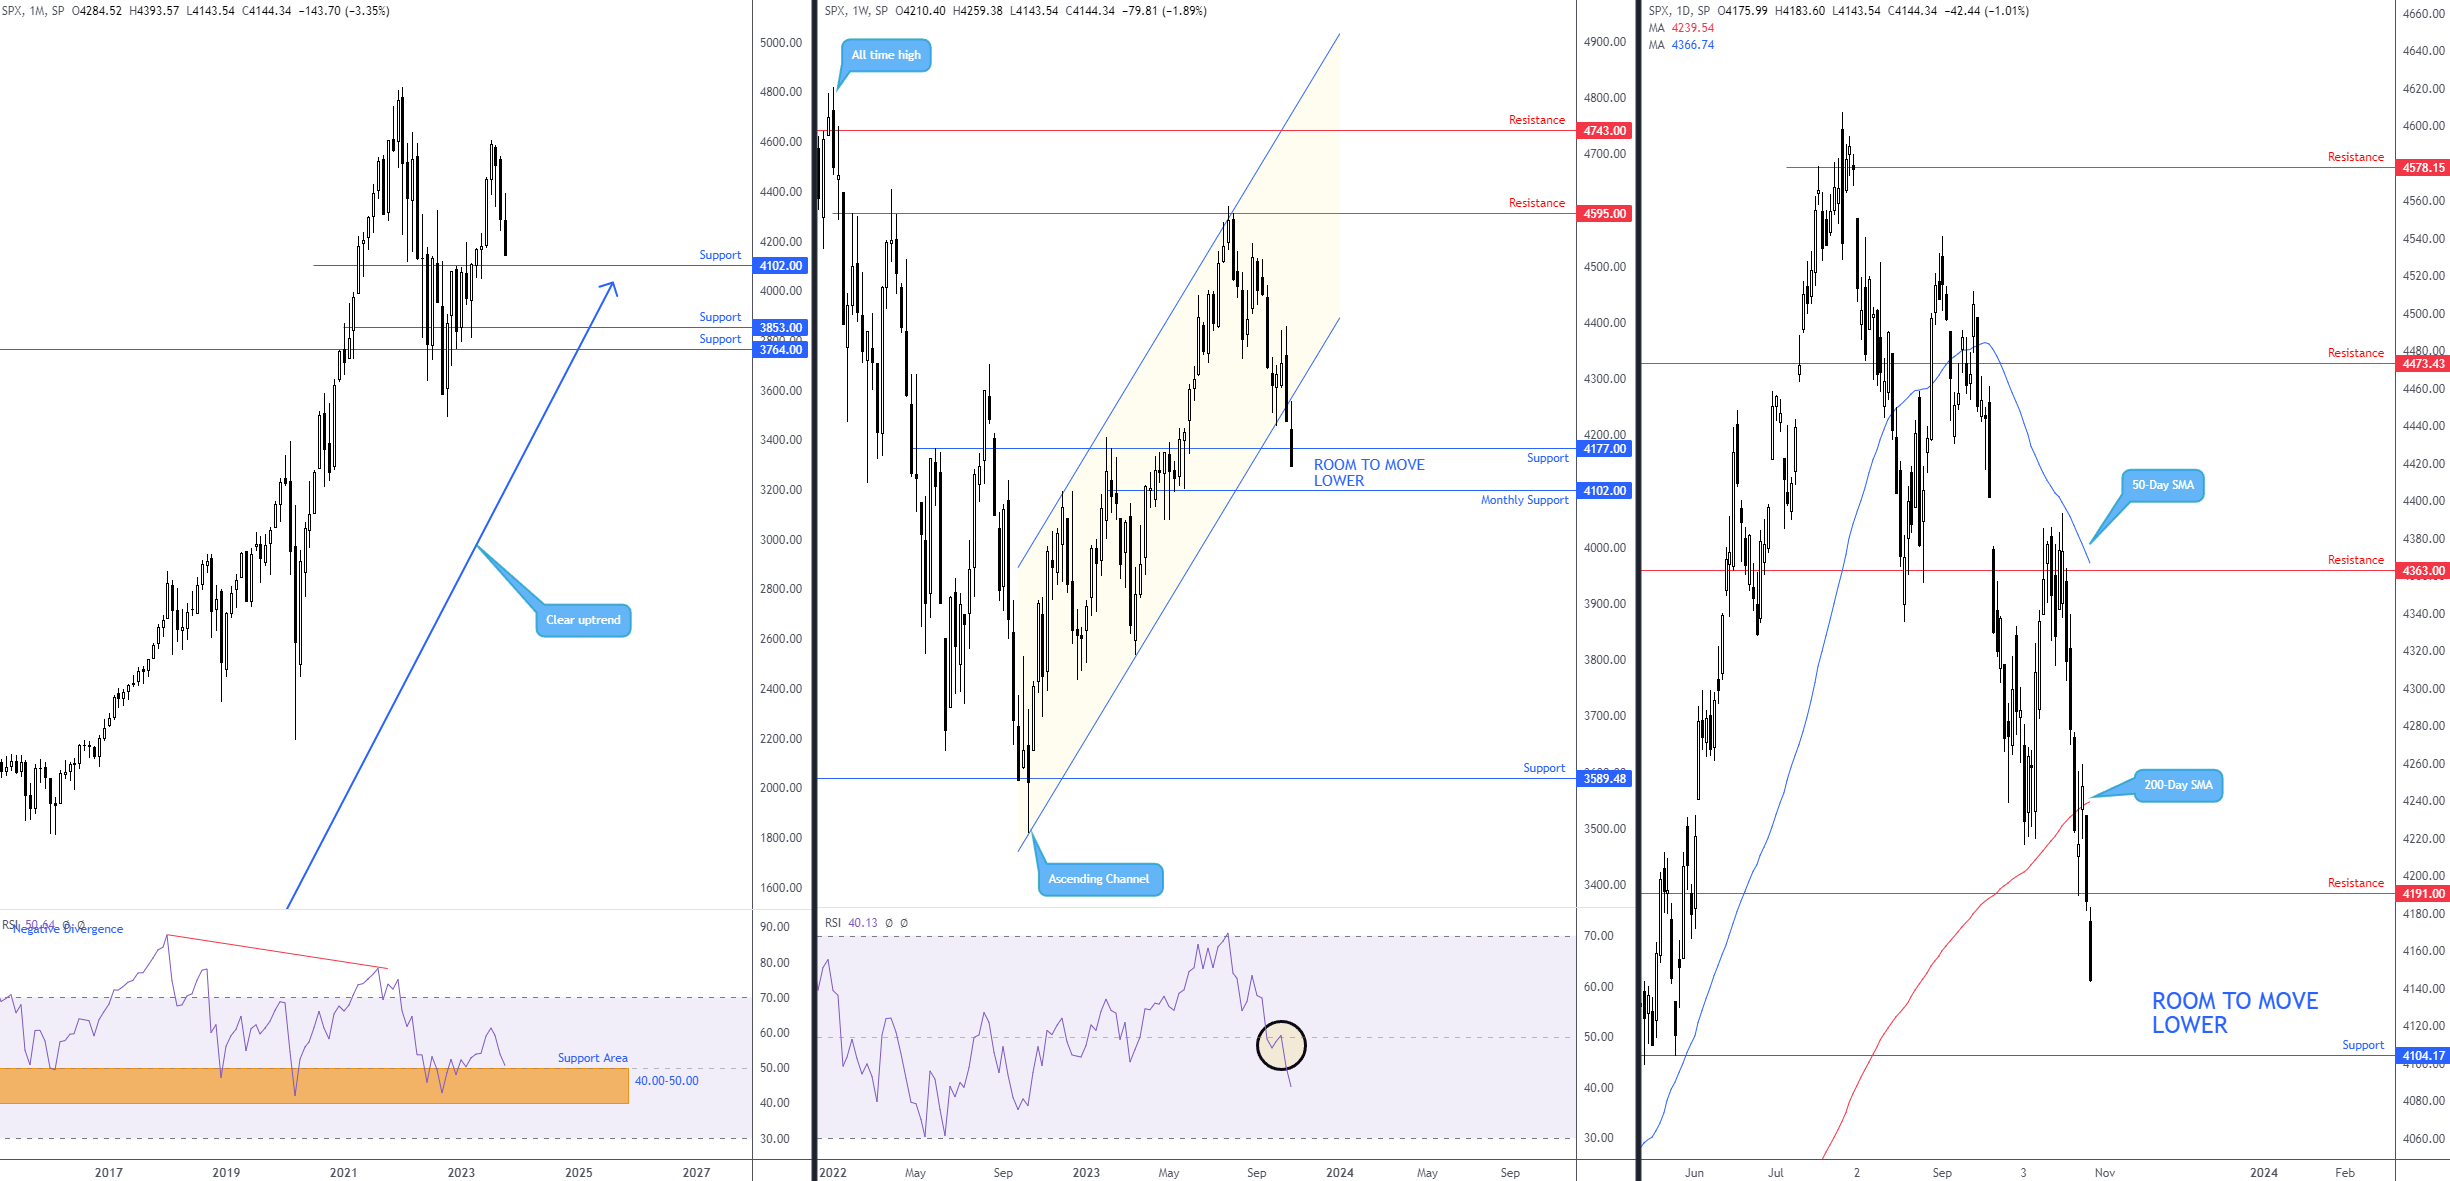
The monthly timeframe—albeit still technically entrenched within a longer-term uptrend—exhibits scope to continue pressing south until shaking hands with support coming in at 4,102. Connecting with the aforementioned base would also likely witness the monthly chart’s Relative Strength Index (RSI) connect with familiar indicator support between 40.00 and 50.00.
Adding to the bearish vibe, as evident from the weekly timeframe, WTD, the index is down -2.0% and pressing bids at support from 4.177. Clearing the noted base would technically uncover the monthly support level mentioned above at 4,102. In addition, you will recall that the unit recently retested the underside of a breached weekly channel support (almost to the point), taken from the low of 3,491. You will also note that the RSI on the weekly chart is comfortably beneath its 50.00 centreline, indicating negative momentum (average losses exceeding average gains).
Moving over to the daily timeframe, recent price action chalked up a failed bullish morning star candlestick formation. This has led the index further beneath its 200-day simple moving average at 4,239 and sent price tunnelling through neighbouring support at 4,191. Engulfing the aforementioned barrier unearths further downside towards support at 4,104, situated a touch north of the monthly support at 4,102.
Author

Aaron Hill
FP Markets
After completing his Bachelor’s degree in English and Creative Writing in the UK, and subsequently spending a handful of years teaching English as a foreign language teacher around Asia, Aaron was introduced to financial trading,