Soybean complex hits all-time COT extreme — And the question is whether prices follow

Large Speculators have reached their most bearish positioning ever recorded in soybeans, soybean oil and soybean meal. The same COT report also flags a bullish extreme in lean hogs and above-average positioning changes in sterling and the New Zealand dollar worth watching.
All-time bearish extreme in the soybean complex — but what comes next?
All-time extremes are rare by definition. When one appears in a single market, it warrants attention. When it appears simultaneously across an entire commodity sector — soybeans, soybean oil and soybean meal — in the same weekly Commitments of Traders report, it becomes the central story of the week.
That is precisely what the 39th COT report of 2026 shows. Large Speculators are at their most bearish net positioning ever recorded in this complex. COT data for soybeans futures and options combined stretches back to 1995, which makes the current reading genuinely historic by the standards of this data set.
A bearish COT extreme in Large Speculators signals that this group of traders has pushed their net short positioning to an unprecedented level. That is notable. It is not, however, a straightforward forecast of lower prices.
In traditional agricultural commodities, there is a scenario worth understanding before drawing conclusions. Commercials in markets like soybeans are predominantly producers hedging against falling prices. When prices rise sharply beyond their expectations, those short hedging positions generate margin calls. If producers do not have sufficient margin reserves, they are forced to close — meaning they buy back contracts, which can actually fuel further upside rather than the decline the positioning extreme might suggest.
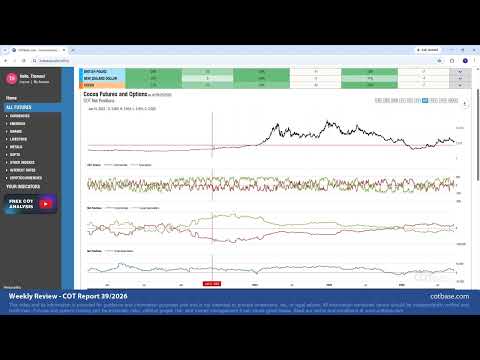
This is what I refer to as commercial capitulation, and it has happened in soybeans before. The October 2020 period is a clear example visible on the chart: positioning was close to an all-time bearish extreme at the time, yet the market continued to rally as producers were squeezed out of their positions.
So is the current situation heading in the same direction? In my view, probably not — but I want to be careful about overstating that. Looking at how the current positioning has developed, Commercials appear to have built their short positions gradually and with more preparation than was the case in 2020, where the increase was more sudden. That suggests, to me, that the margin situation may be more manageable this time. I would argue the probability of a price decline from this extreme is higher than the probability of commercial capitulation — but I may be wrong, and the chart will ultimately tell us.
What a decline might look like is also worth framing. A historical comparison from the chart — a period running from roughly early November to early the following year — showed a decline of around a month and a half following a similarly stretched positioning level. Even if prices do fall, a short-lived correction rather than a sustained downtrend is one plausible scenario.
Soybean meal shows a comparable picture, with its own all-time COT extreme and similar questions around capitulation risk. The analytical logic is the same, and I would treat the two markets as broadly aligned in their signal.
Lean hogs: A bullish extreme on the opposite side
Lean hogs appear in the same report but with the opposite character. Large Speculators are at a bullish COT extreme, and the market is trading at its lowest levels visible on the five-year chart.
This follows a bearish extreme in August — which at the time seemed surprising given how low prices already were, but which proved to be a reasonable signal that further weakness was ahead. The current bullish extreme, which is larger than previous comparable readings on the chart, suggests higher prices could follow over the coming weeks or potentially the next month. COT extremes can persist before price reacts, so timing remains open, but the directional lean from positioning is clear.
British Pound and New Zealand dollar: Larger-than-average weekly changes
Outside the commodity complex, both the British pound and the New Zealand dollar recorded notable weekly positioning changes in Commercials — 29% and 28% respectively — both qualifying as larger than average.
For sterling, this constitutes a bullish COT change signal. ICOT scores, COTbase's shorter-term positioning tool, are also pointing in a bullish direction. Moving to the five-year chart, the market is shifting towards a more bullish COT extreme territory. A comparable configuration appeared around November of last year and was followed by a bounce. The medium-to-longer-term read suggests further upside potential in the British pound against the US dollar, though short-term price confirmation would strengthen the case.
The New Zealand dollar tells a more mixed story. Commercials have moved back above the zero line and are net long again, while ICOT scores are registering in the 65–70 range, which is bullish on the shorter-term view. The five-year positioning picture is less convincing: the current extreme is not as bullish as sterling's and remains less stretched than the more bearish configuration seen around June 2024. A bottoming pattern over the next week or two is possible, but I would consider this a less fully developed signal than what we are seeing in sterling.
Key takeaway
The headline development this week is the all-time COT extreme across the soybean complex. The signal is historically significant, and the balance of evidence, in my view, leans towards a price decline rather than commercial capitulation — but that distinction is not certain, and the market's next moves will clarify which scenario is playing out. Lean hogs offer a cleaner bullish read at the other end of the commodity spectrum. Sterling and the New Zealand dollar add positioning support for further upside in both currencies, with sterling showing the stronger and more developed signal of the two.
Watch the full COT analysis for Report 39 of 2026, including the chart walkthroughs and ICOT score detail:
This content was partially created by an AI tool.
Author

Thomas Lukacs
COTBase.com
Thomas Lukacs is the founder and CEO of COTbase.com.