Rising gold, silver point to Wall Street correction

Gold and silver have started the new week how they ended the last one: higher. Last week saw silver extend its bullish run for the sixth straight week while gold recorded its fifth weekly gain in six. Correspondingly, it was the dollar’s fifth losing week in six as the Dollar Index fell below 100. US stock markets ended the week higher, however, with the S&P 500 index extending its bullish run for the fifth consecutive week. Thus, gold’s bullish run thus far has been more or less entirely due to a weaker dollar. Had the US stock markets weakened at the same time, gold would have presumably been much higher for it would have also benefited from a boost due to its safe haven attributes.
US stocks due a correction?
But some of the European stock markets have dropped sharply today and there is a possibility that this “risk off” trade will continue on Wall Street later. Thus, gold could be in for a much larger recovery, should the US stock markets also turn lower today or in the coming days. Indeed, gold’s most recent upsurge does point to a possible correction on Wall Street. Share prices have been hitting new all-time highs repeatedly in recent times without any further fundamental support. It is becoming apparent that only a handful of individual stocks are holding up the entire market. Valuations have already been looking stretched, while the Fed has started to tighten its monetary policy, which is not good for stocks. Meanwhile the impact of Trump’s planned fiscal spending will likely be limited. What’s more, the rally on some indices look almost parabolic – in other words, unsustainable. So, a correction could be on the way for US stock markets. But given that the major US stock indices are near their record high levels, we are hesitant to turn bearish yet and it is impossible to predict the timing of the upcoming crash. But the stage looks set, so be prepared.
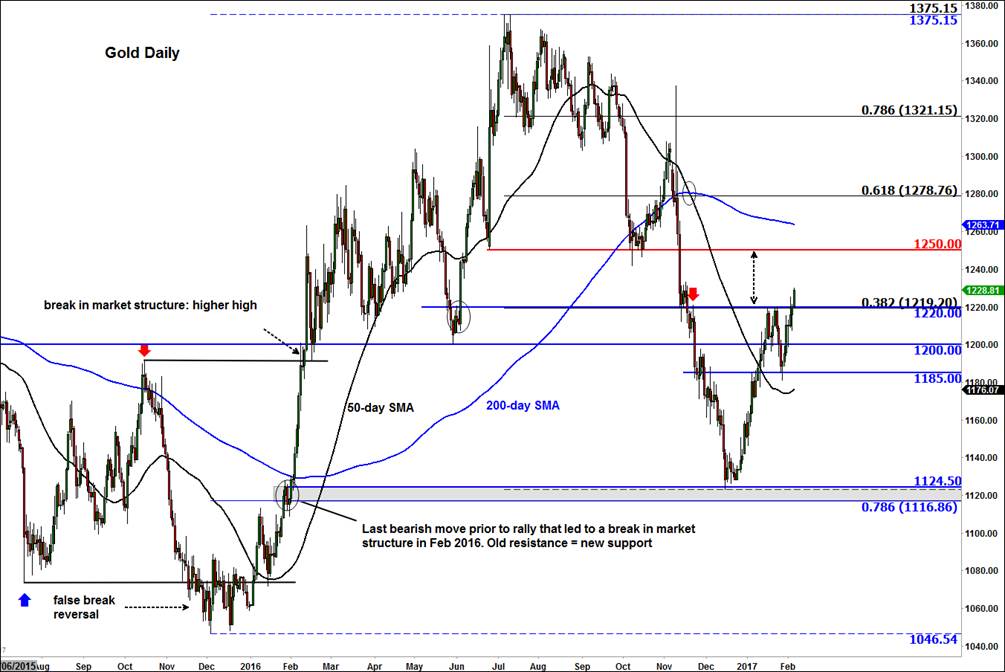
Gold finally clears key resistance level
In addition to a weaker dollar and uncertainty over the stock markets, the price of gold has made a technical breakthrough today. After several unsuccessful attempts, gold has finally broken the $1220 resistance level. While it holds above this level, the path of least resistance would be to the upside now. Consequently, gold could rise towards the next resistance level at $1250 next. But potentially it could reach the 200-day moving average at $1263 or even the 61.8% Fibonacci retracement level against the high from last year, at $1278, before deciding on its next move.
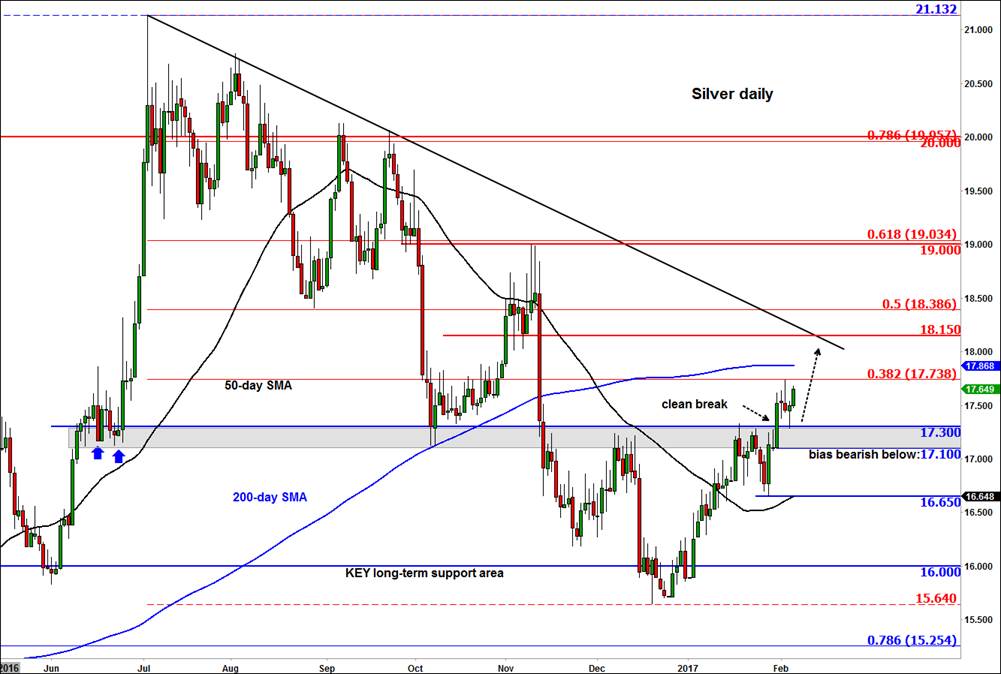
Silver had made its move before gold
Silver, which had already broken its own key resistance level at around $17.10/$17.30 area prior to gold’s move, looks to be going higher, too. On Friday, this breakout level was retested on the back of a mixed-bag US jobs report, and it held as support this time. As a result, the precious metal bounced back to turn positive on the day. Going forward, until and unless silver moves back below this key $17.10/$17.30 support range, the path of least resistance is likewise going to be to the upside - until at least the time when it forms a bearish pattern at higher levels. Some of the bullish objectives include $17.85, the 200-day moving average; $18.15, the underside of the bearish trend line, and $19.00, the most recent swing high and 61.8% Fibonacci level.
Figure 1:
Source: eSignal and FOREX.com.
Figure 2:
Source: eSignal and FOREX.com
Author

Fawad Razaqzada
TradingCandles.com
Experience Fawad is an experienced analyst and economist having been involved in the financial markets since 2010 working for leading global FX, CFD and Spread Betting brokerages, most recently at FOREX.com and City Index.