Results & Update: S&P 500 Index one of the biggest of the month with four powerful top notch events

Recap 4/08 – Friday, the S&P opened with a 6 handle gap down and then declined another 19 handles into a 9:59 AM low of the day. From that low, the S&P rallied 45 handles into a 12:29 PM high of the day. From that high, the S&P declined about 34 handles into the close.
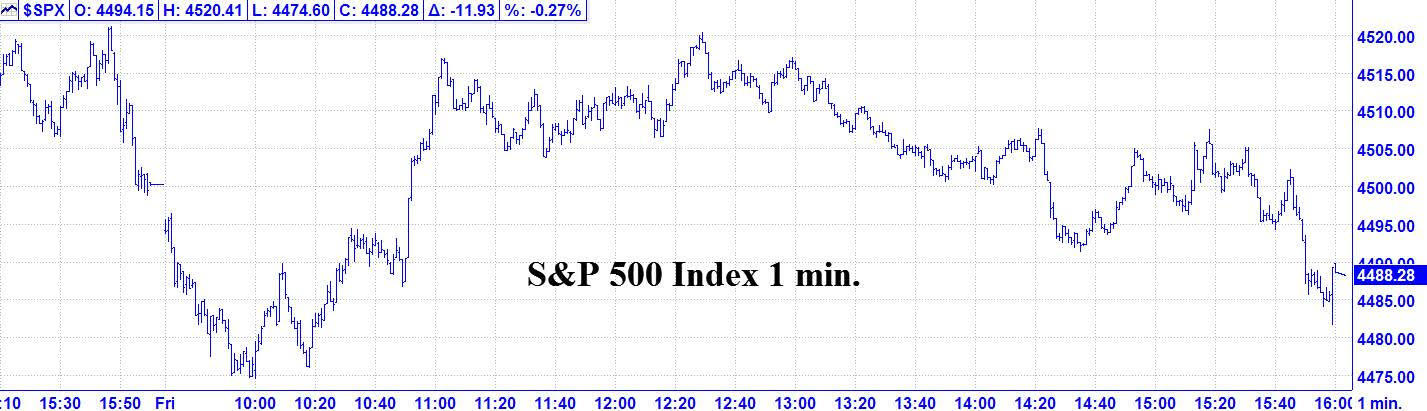
4/08 – The major indices had a divergent mixed up and down day to finish per the following closes: INDU + 137.55; S&P 500 - 11.93: and the NASDAQ Composite - 186.30.
Looking ahead - Our next change in trend window is for 4/08 AC and is one of the biggest of the month with four powerful top notch events.
However, Friday’s price action was not very promising in providing a good set up. We look for the market to get to some extreme as it approaches a change in trend window. The bigger the extreme the better. Usually, the bigger the change in trend window, the bigger extreme. Obviously, this was not the case on Friday. The only thing that could qualify this for a potential good entry is a big gap up or down on Monday. Otherwise, this may indicate that the market is stuck in a sideways range for a while. Please see details below.
The Now Index is in the NEUTRAL ZONE.
Coming Events:
(Stocks potentially respond to all events).
2. A. 4/08 AC – Mercury 0 North Latitude. Major change in trend Corn, Oats, Soybeans, Wheat.
B. 4/08 AC – Venus 0 South Latitude Major change in trend Cattle, Copper, Cotton, Sugar & Wheat.
C. 4/08 AC – Jupiter Parallel US Saturn. Major change in trend US Stocks, T-Bonds, US Dollar.
D. 4/08 AC – Jupiter Parallel Neptune. Major change in trend Commodity Index, Oats, Oil.
E. 4/12 AM– Jupiter 0 Neptune. Major change in trend Commodity Index, Oats, Oil.
F. 4/12 AC – Jupiter 60 Moon’s North Node. Moderate change in trend Cattle, Commodity Index, Cotton, Oats, Oil.
Stock Market Key Dates –
Market Math –
4/15/ 22 – 16,641(129^2) from 9/22/1976 major high.
DJIA* – 4/11, 4/18, 4/26
Fibonacci – 4/9, 4/18, 4/21, 4/29
Astro – *4/11*, 4/12, 4/18, 4/25, 4/28, 4/29, 4/29 AC
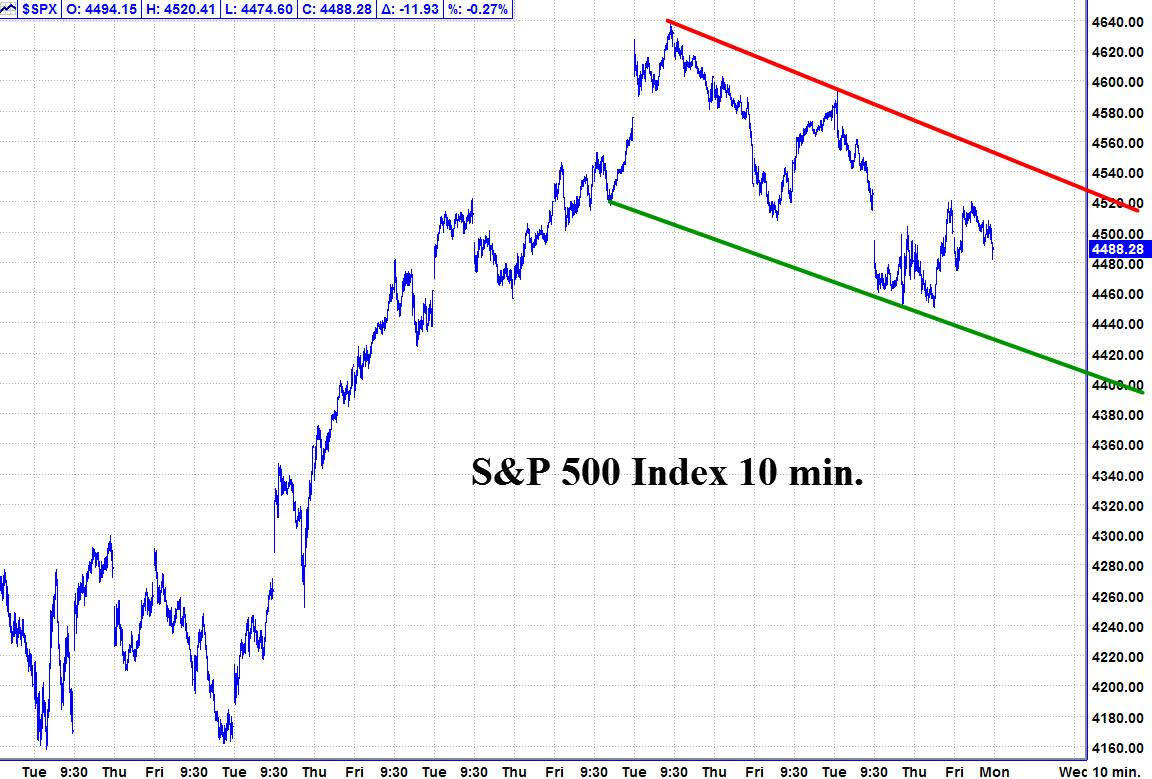
Please see below the S&P 500 10 minute chart.
Support - 4450 Resistance – 4520
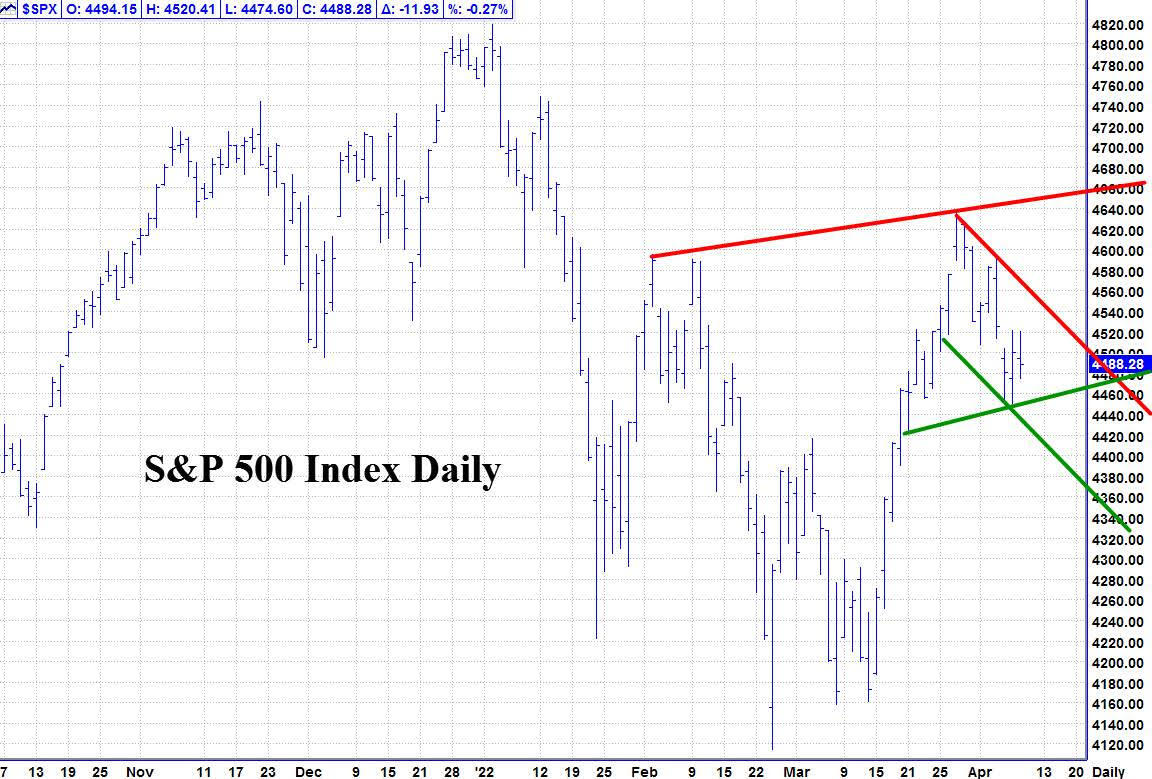
Please see below the S&P 500 Daily chart
Support - 4450 Resistance – 4520, 4580
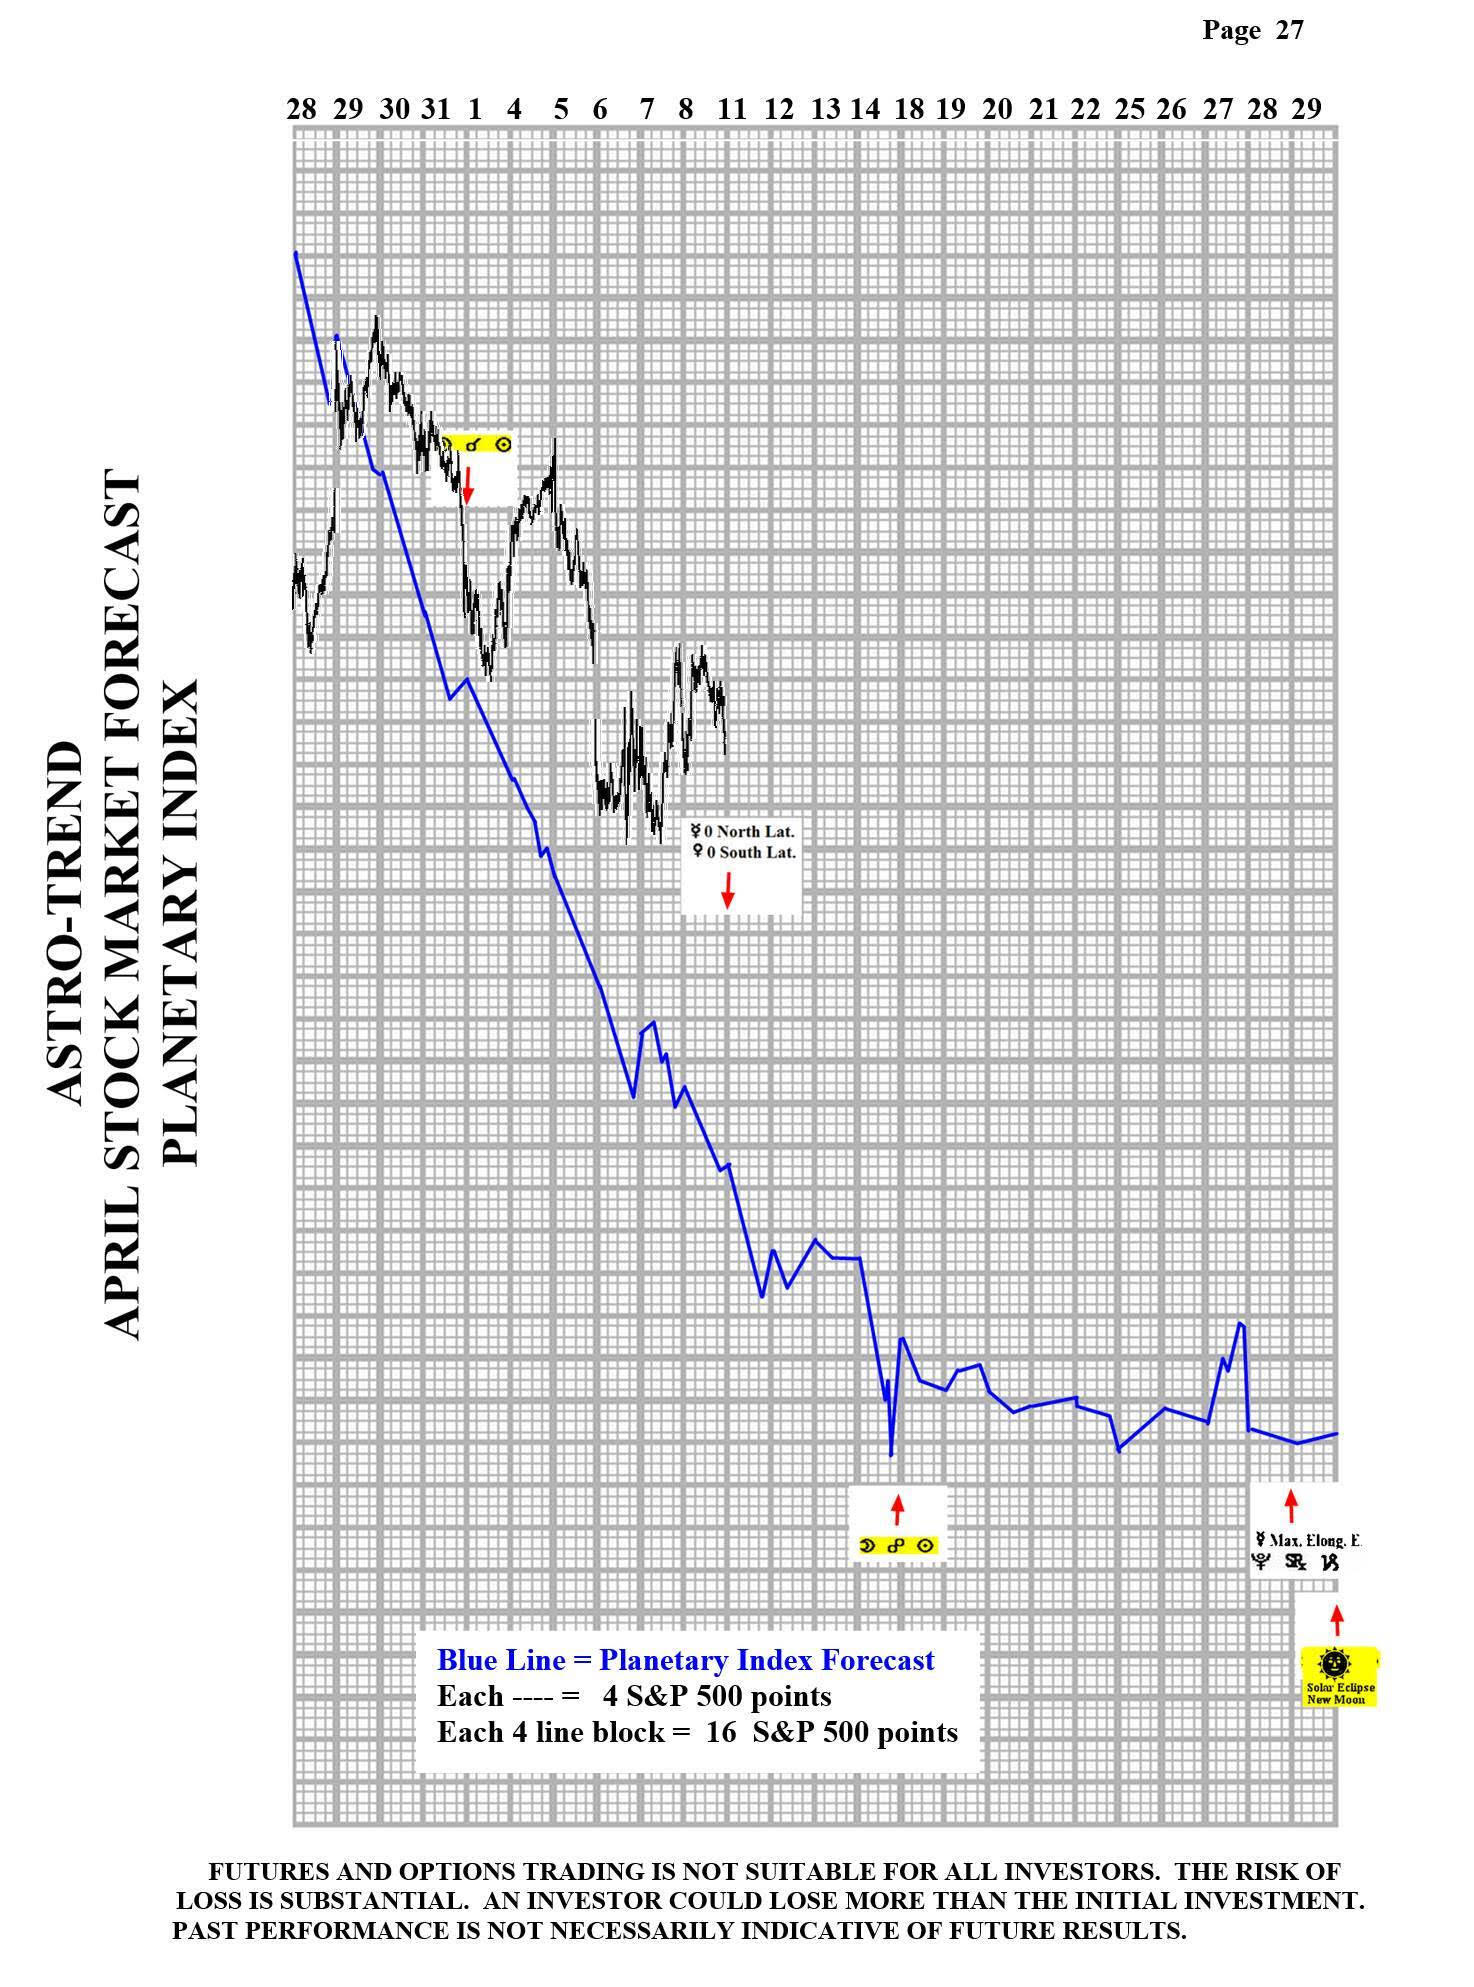
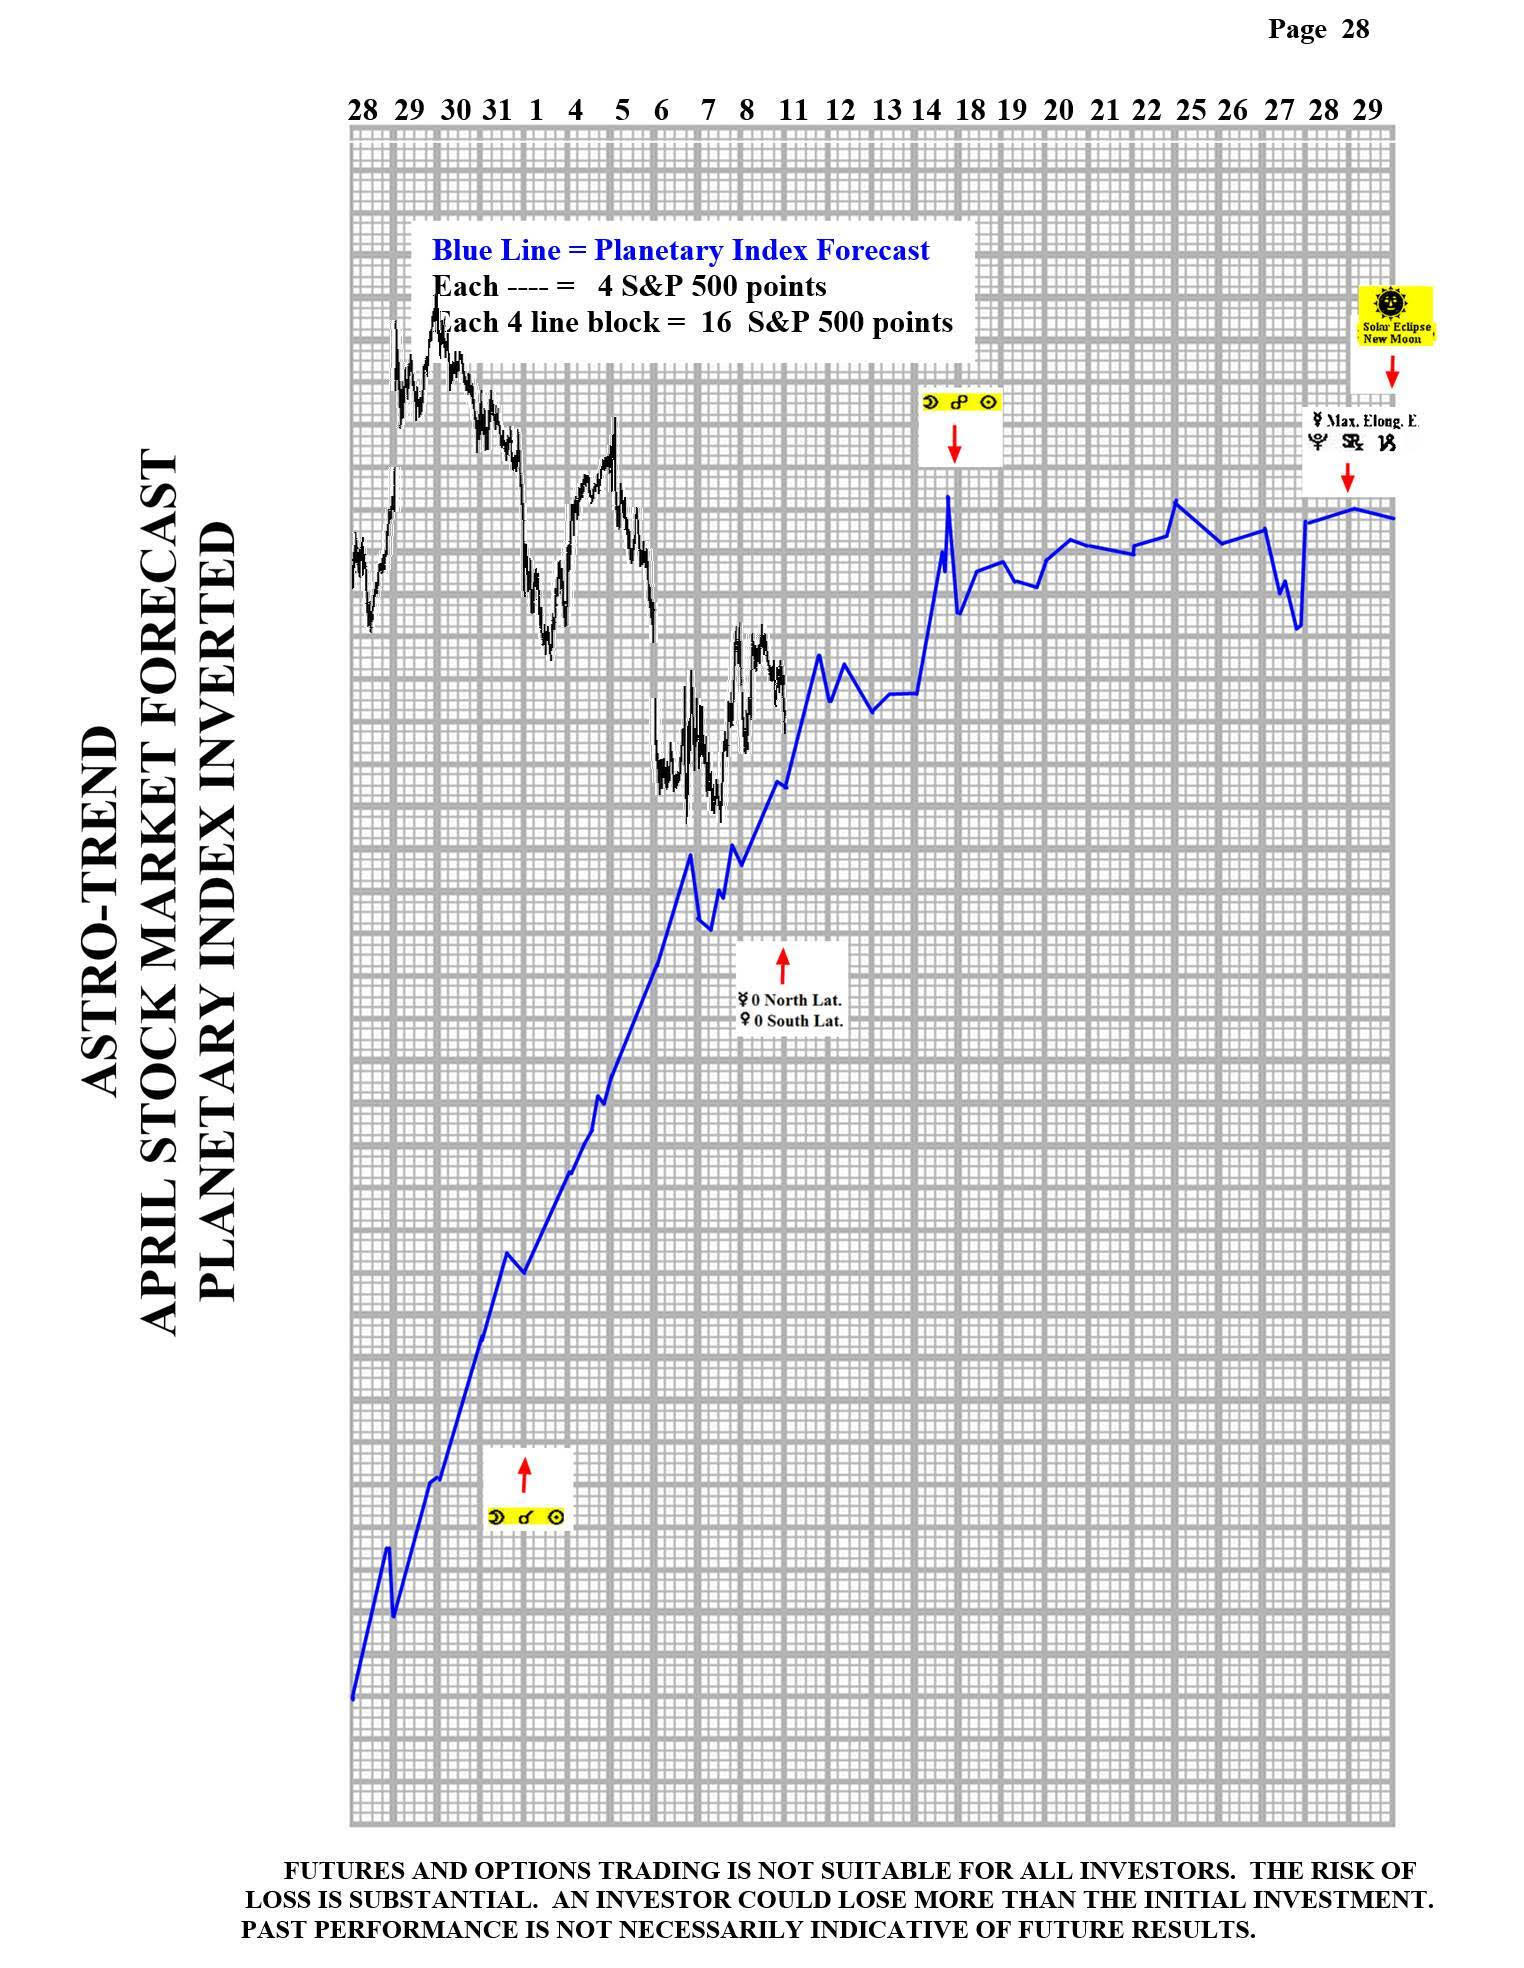
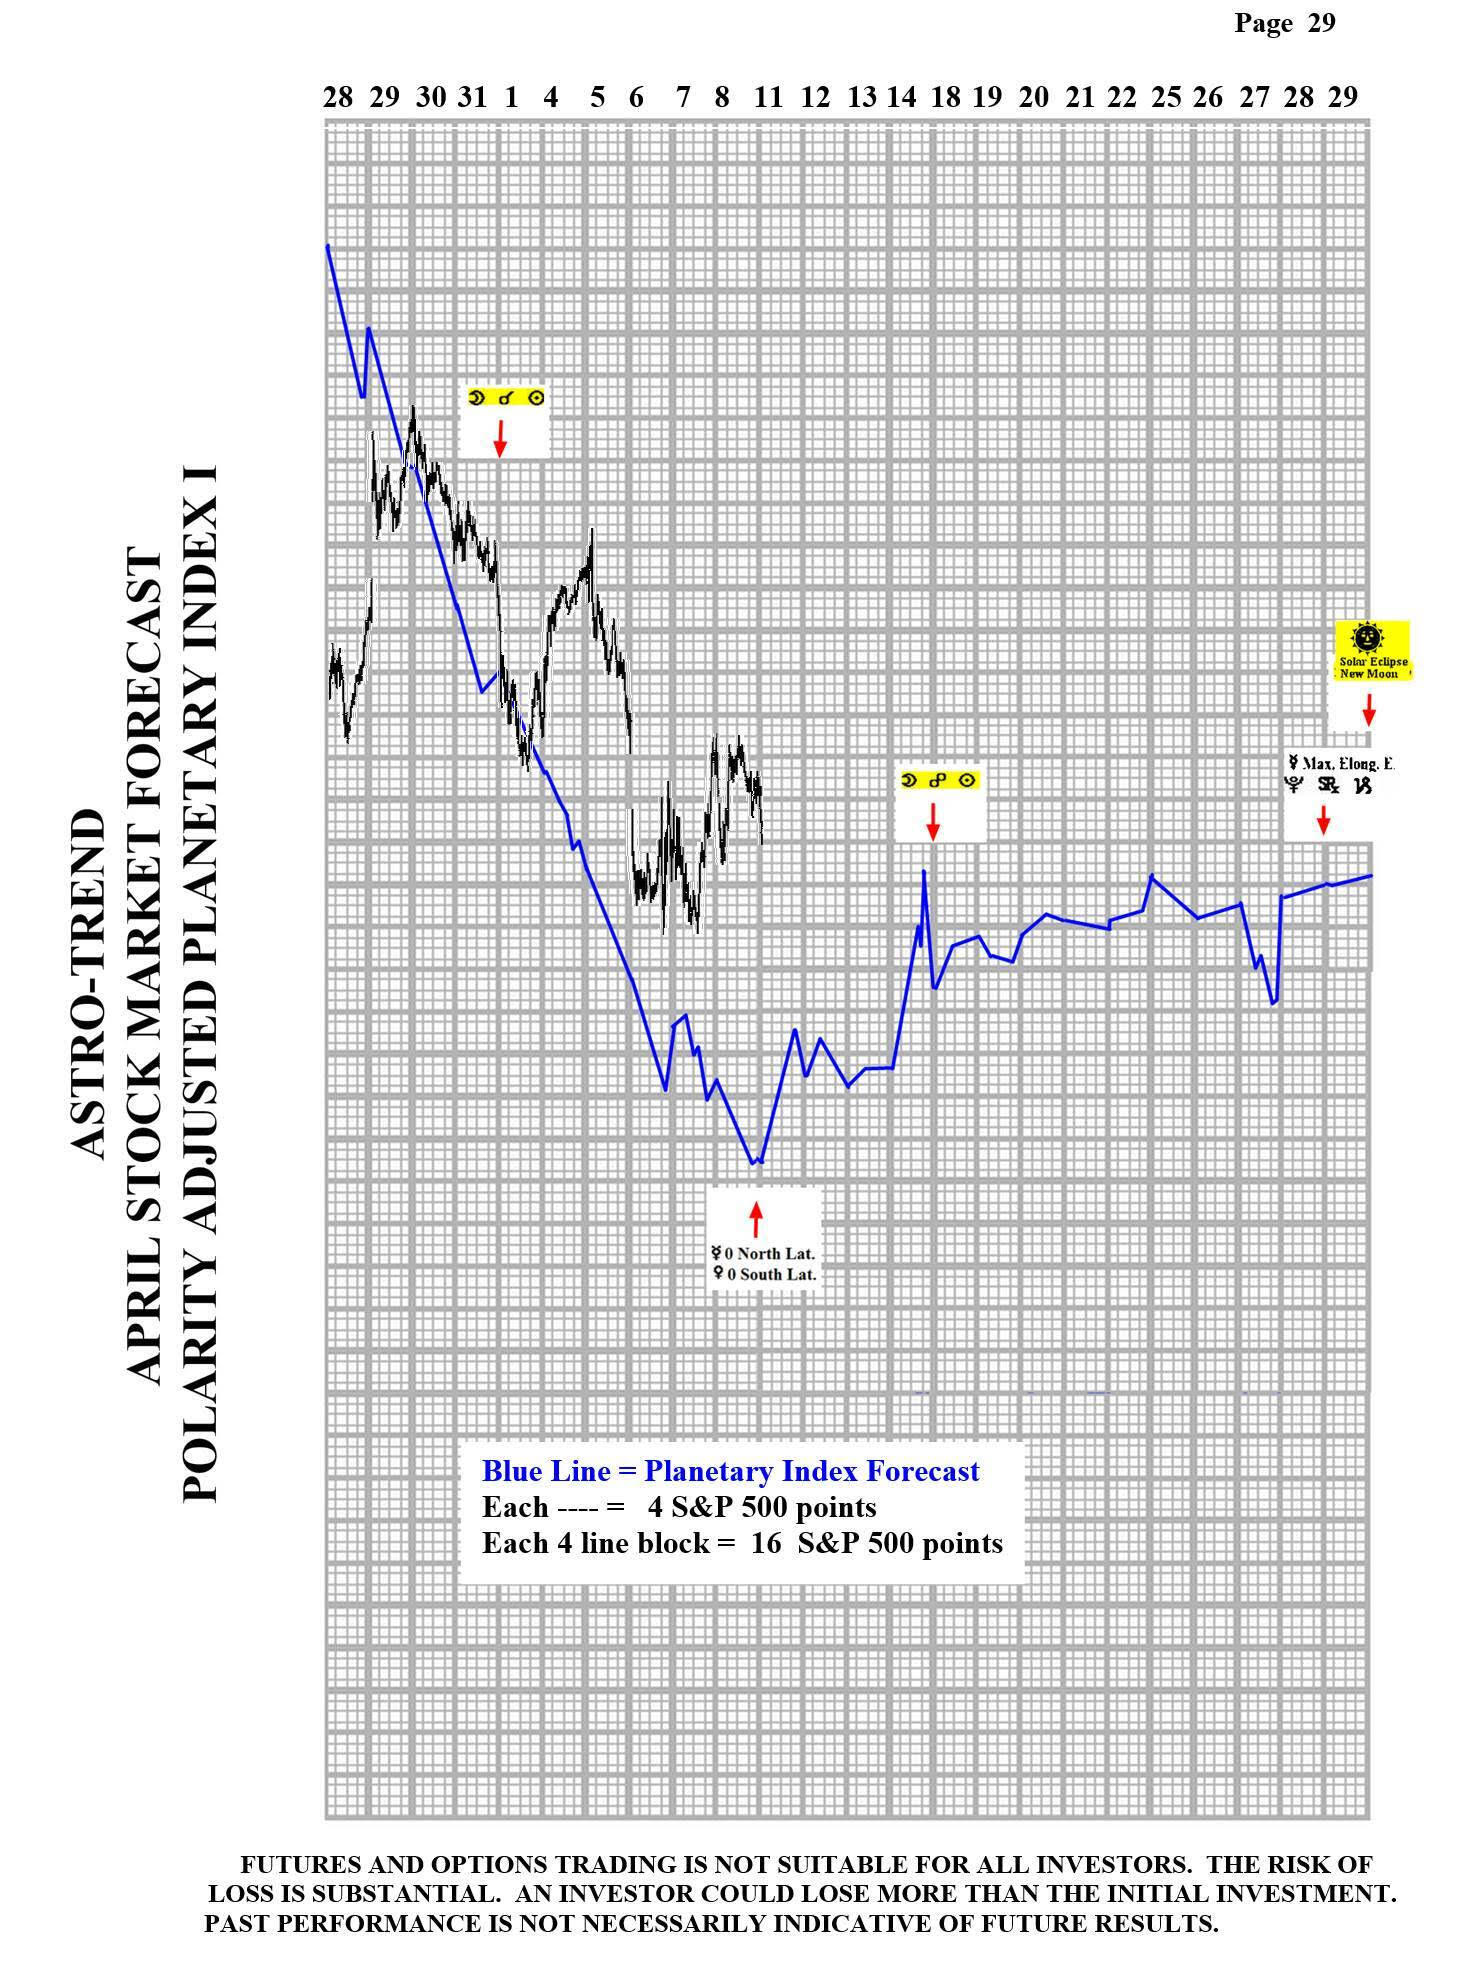
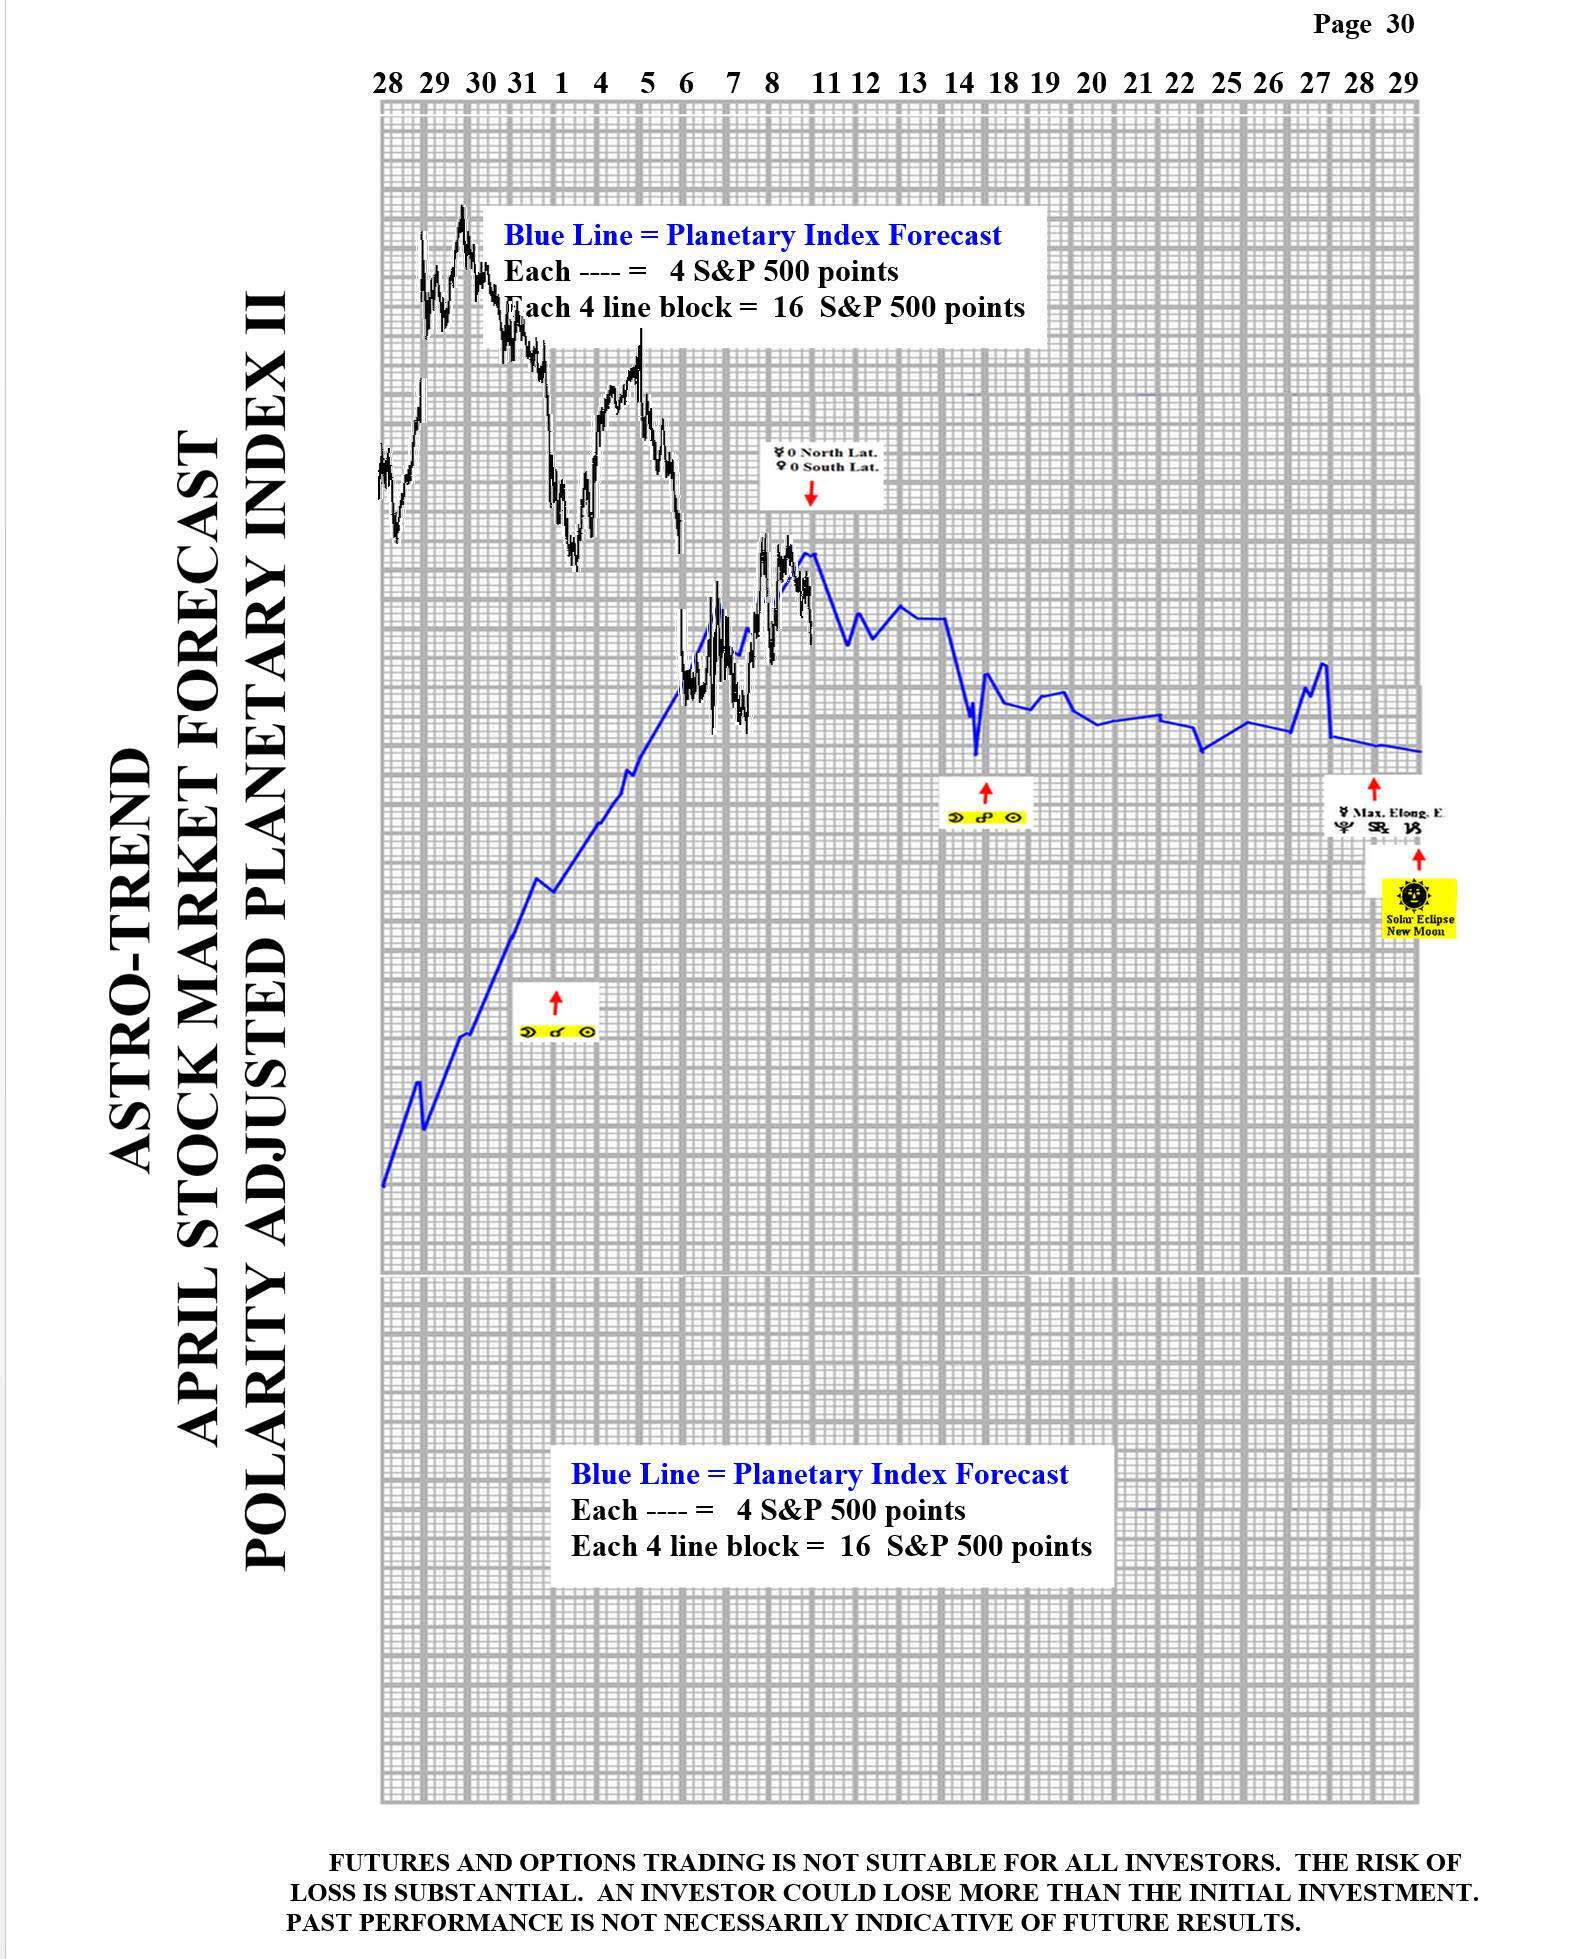
Please see below the March Planetary Index charts with S&P 500 5 minute bars for results.
Author

Norm Winski
Independent Analyst
www.astro-trend.com