Protectionist fears flood markets as risk appetite plummets

Market Overview
Risk appetite has plummeted as fears over protectionism and a trade war between the world’s two largest economies have taken hold. Yesterday, Donald Trump signed a memorandum on potentially $60bn of trade tariffs on China . China’s response was “China is not afraid of and will not recoil from a trade war”, according to the China embassy in Washington. Although China has only announced around $3bn of tariffs on US goods, so far, these are not the words of a nation willing to stand aside and let this happen quietly. It may be that quite how China deals with this situation in the coming days will determine the market’s appetite for risk again. The big loser is global trade and ultimately the end consumer. Subsequently, the dollar has come under renewed pressure and investors have sought after safe haven plays. Treasury yields continue to fall back on growth fears, with the US 10 year yield now around 2.81% (it has lost over 12 basis points now since the Fed meeting). In the forex space, the yen is a chief outperformer in this situation, however the dollar is underperforming across the majors. Aussie/Yen (the chart of the day) is a key indicator of risk appetite and has fallen to 16 month lows in the past 24 hours. Gold has also taken a leg higher. However the most stark move has come with a massive sell-off on Wall Street last night, with the Dow losing over 700 points. This selling pressure flooded into Asian markets and subsequently the Europeans are feeling the brunt today.

Wall Street closed sharply lower last night, with the S&P 500 -2.5% at 2644, whilst Asian markets were absolutely slammed overnight, with the Nikkei almost 1000 points lower (down 4.5%). European markets are also under early pressure, although interestingly not as much as perhaps expected. In forex, there is broad selling pressure on the dollar today with little real standout performer in early moves, although it is interesting to see the sterling strength fading. In commodities, the dollar weakness and safe haven move has seen gold shoot higher by $13 whilst oil is also around 1% higher, helped by comments from Saudi Arabia that the cooperation on production between OPEC and Russia needed to continue into 2019.
Friday brings a rather hectic week of data to a close with a very quiet European morning and little to trouble traders until the US Core Durable Goods Orders (ex-transport) which are at 1230GMT and are expected to grow by +0.5% on the month (after a decline of -0.3% last month). Canadian CPI inflation for February is at 1230GMT and is expected to move higher to +2.0% for the year. US New Home Sales are at 1400GMT and are expected to improve by 4.7% to 621,000 (from 593,000 last month).
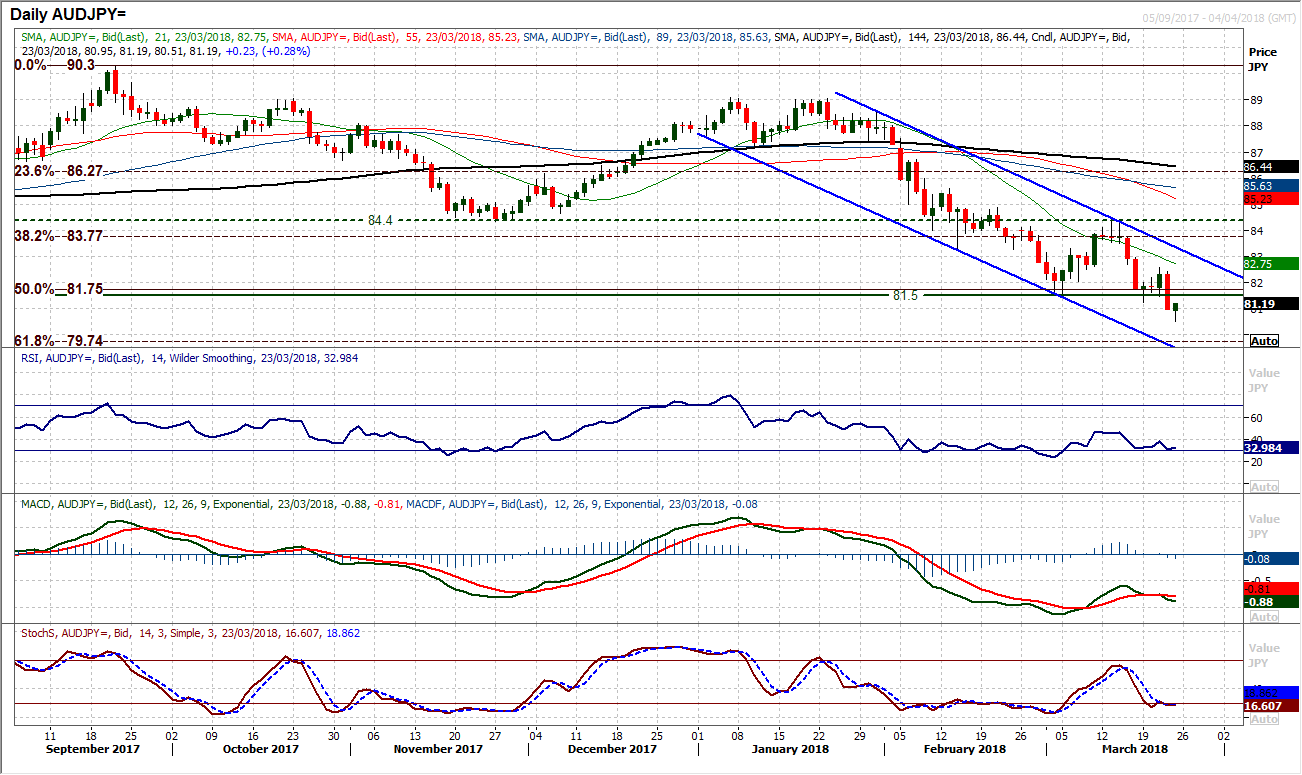
Chart of the Day – AUD/JPY
The increased concerns over US protectionism and how this will impact on global trade are played out in Aussie/Yen. The Aussie is linked to Chinese growth and is a higher risk major currency, whilst the yen is a safe haven. Subsequently with risk appetite dramatically deteriorating yesterday, we see a huge bear candle formation on AUD/JPY. Technically we also see a key move to the downside, as the intraday move below 81.25 support but also, and more decisively, a close below 81.50 which is a 16 month closing low. The technical deterioration continues on the medium term downtrend channel that has formed in recent months. Concern also comes with the negative configuration on the momentum indicators which show the MACD lines again crossing lower whilst the RSI still has downside potential in the latest move. Rallies are now a chance to sell. Wednesday’s lower high at 82.57 is now clearly key near term resistance whilst the hourly chart shows resistance now between 81.50/81.80 is now a selling area as old support becomes new resistance. Continued trading below 81.50 increases the corrective move of the long term bull run from 73.21/90.30 with the 50% Fibonacci retracement having been broken at 81.75 which now opens the 61.8% Fib retracement at 79.74. The initial support is the overnight low at 80.51, with 80.00 the next real basis of support before 79.75 the 61.8% Fib retraement.
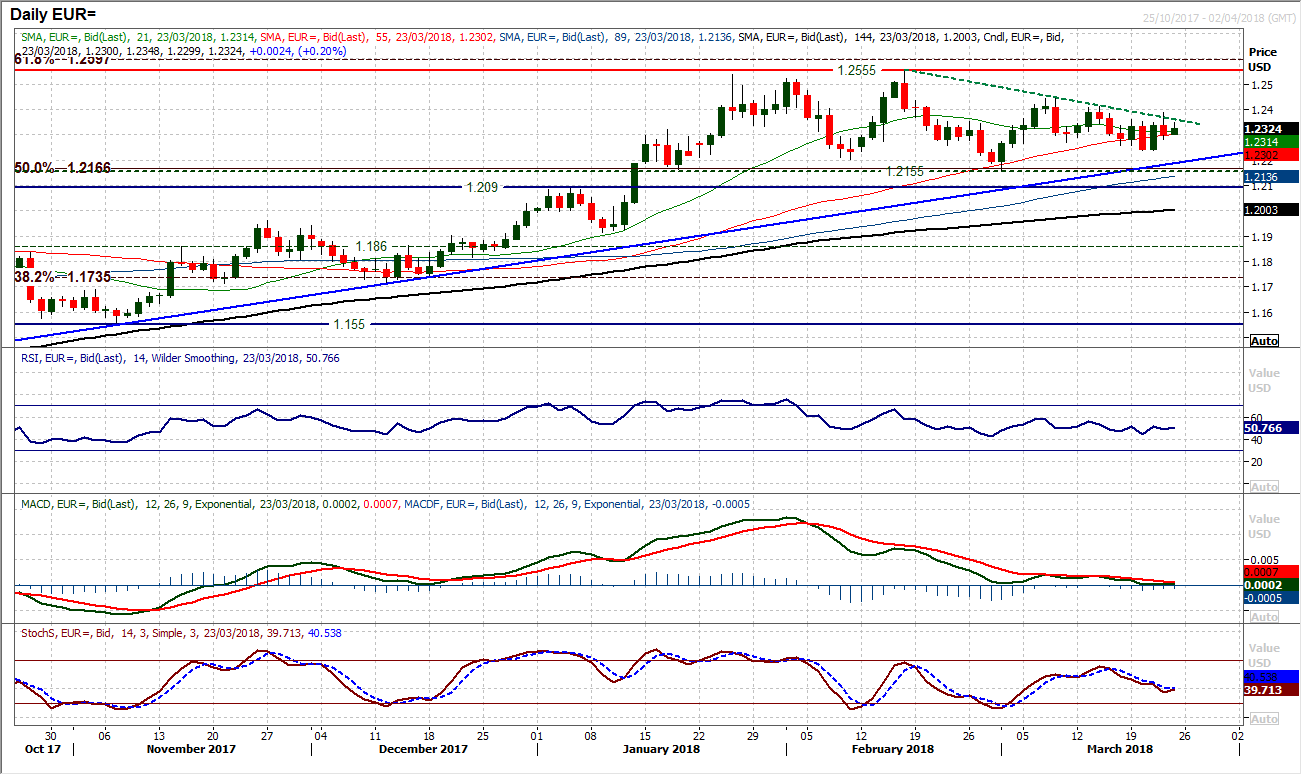
EUR/USD
Amidst the market meltdown over a prospective trade war between the US and China it was interesting to see EUR/USD actually fell on the day yesterday. That move is being retraced early today but the euro is struggling for traction against the dollar. The downtrend of the past five weeks is again being tested today but it has been difficult for the pair to gain any traction recently. This comes with momentum indicators very neutrally configured on the daily chart (albeit with the most marginal of negative bias on the Stochastics). The overhead resistance around $1.2400 remains tight with recent highs of the past two weeks at $1.2390, $1.2412 and $1.2445. The hourly chart suggests the market is trading on a bid today (with the dollar on offer across the majors) but there is little indication of any decisive imminent move. The initial support is at $1.2283 above the key near term $1.2240.
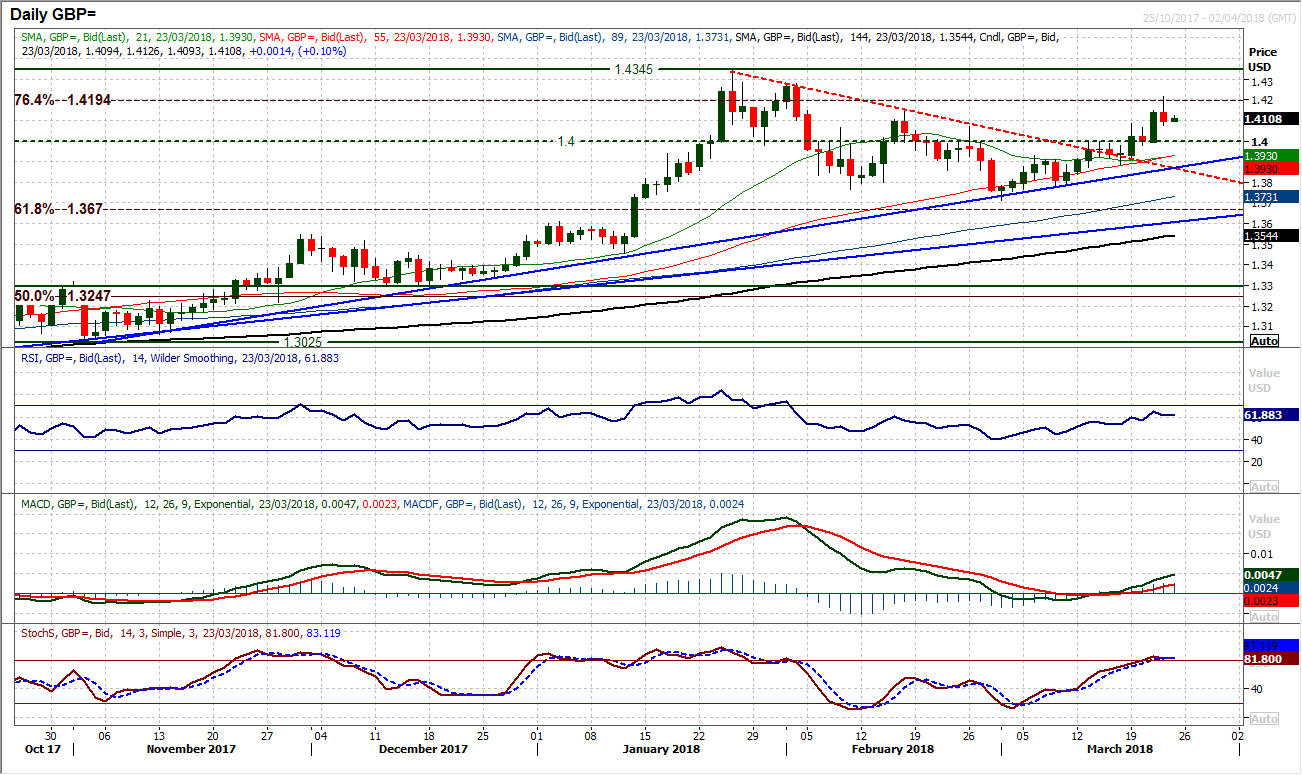
GBP/USD
Corrections on Cable remain a chance to buy. The breakout above $1.4000 was a key psychological move that the bulls have built on this this week. Despite turning back from a push to $1.4215 and posting a negative looking candle, the bulls will be looking to buy into weakness.. The momentum indicators are positively configured with the MACD lines swinging higher and RSI settled above 60. The uptrend support comes in around $1.3870 today so there is room for a corrective slip, but there is a band of near term support now between $1.4000/$1.4085 which the bulls will be looking to build support. This is reflected on the hourly chart where it is interesting to see the hourly RSI bottoming again in the low 40s and the MACD lines bottoming around neutral. A loss of $1.4000 would be disappointing now but as long as the primary uptrend remains intact there is little reason for the bulls to be overly concerned. A push back above $1.4215 re-opens $1.4275 and the key high at $1.4345.
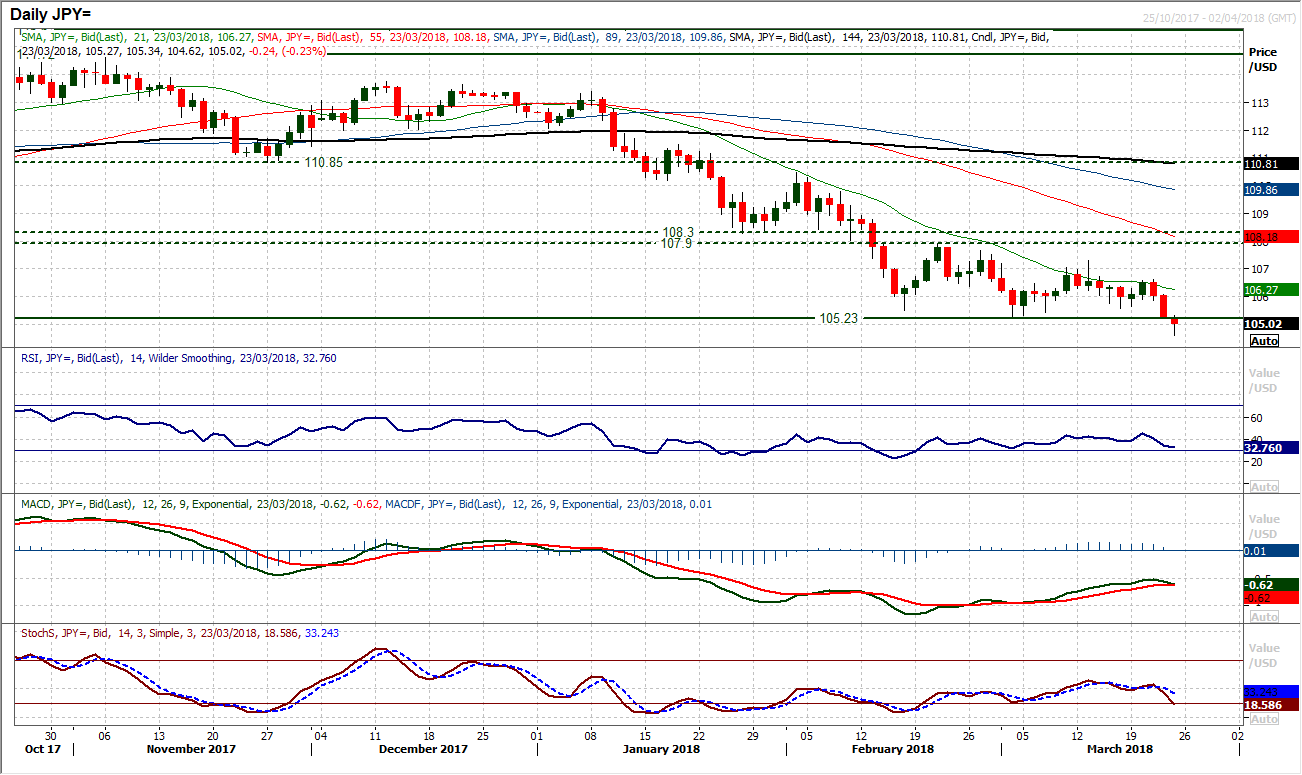
USD/JPY
As risk appetite has plummeted in the past 24 hours, so the yen has strengthened. Posting two consecutive decisive bear candles the market has now broken to a new low dating back to November 2016. In the past few weeks there had been a succession of rebounds as the buyers had been returning around 105.50 however this has been decisively blown away now as the bears have taken control again. All the while the market has been posting a series of lower highs and now the floor has been breached. In effect now there is little real support until around 102.50, but the move back towards 100 is back on. Daily momentum indicators are negatively configured (MACD and Stochastics lines both with a bear cross) but also suggest there is further downside potential (with the RSI in the low 30s, whilst the February sell-off went into the low 20s). Old support now becomes new resistance as rallies will find overhead supply in the area between 105.23/105.60 of all those who bought around the old floor. The key resistance is in place now at 106.65. The hourly chart shows any unwinding move on the hourly RSI towards 40/50 is being sold into.
Gold
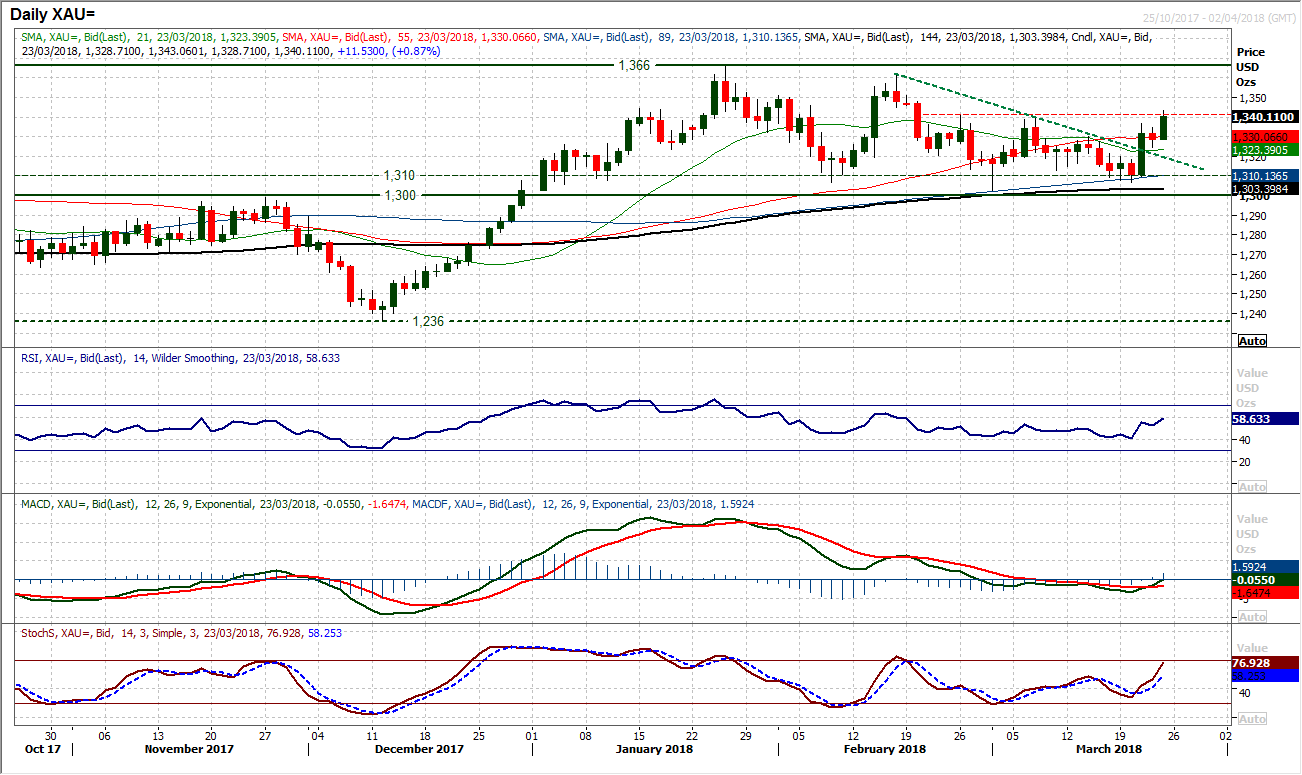
After an uncertain day yesterday the gold bulls have once more run higher early today as the dash for safety seems to have taken hold once more. Breaking above $1330 was a key move that averted the bear control of the $65 near three month trading range, but if the price can now close above $1341 it would suggest the bulls have the market by the scruff of its neck. Momentum indicators are beginning to find traction to the upside once more with the RSI and Stochastics rising strongly, however the MACD lines (which are a more considered momentum indicator) need to see some more to convince. Despite this though, having broken above $1341 this morning the support will now see $1330/$1341 as a support zone to defend. The hourly chart shows positive configuration on hourly MACD and RSI configuration, with yesterday’s low at $1324.50 now a key level of support near term. Breaking above $1341 on a closing basis would confirm a bull control within the range and imply a move to test the highs again at $1366 could be seen. What a turnaround in sentiment!
WTI Oil
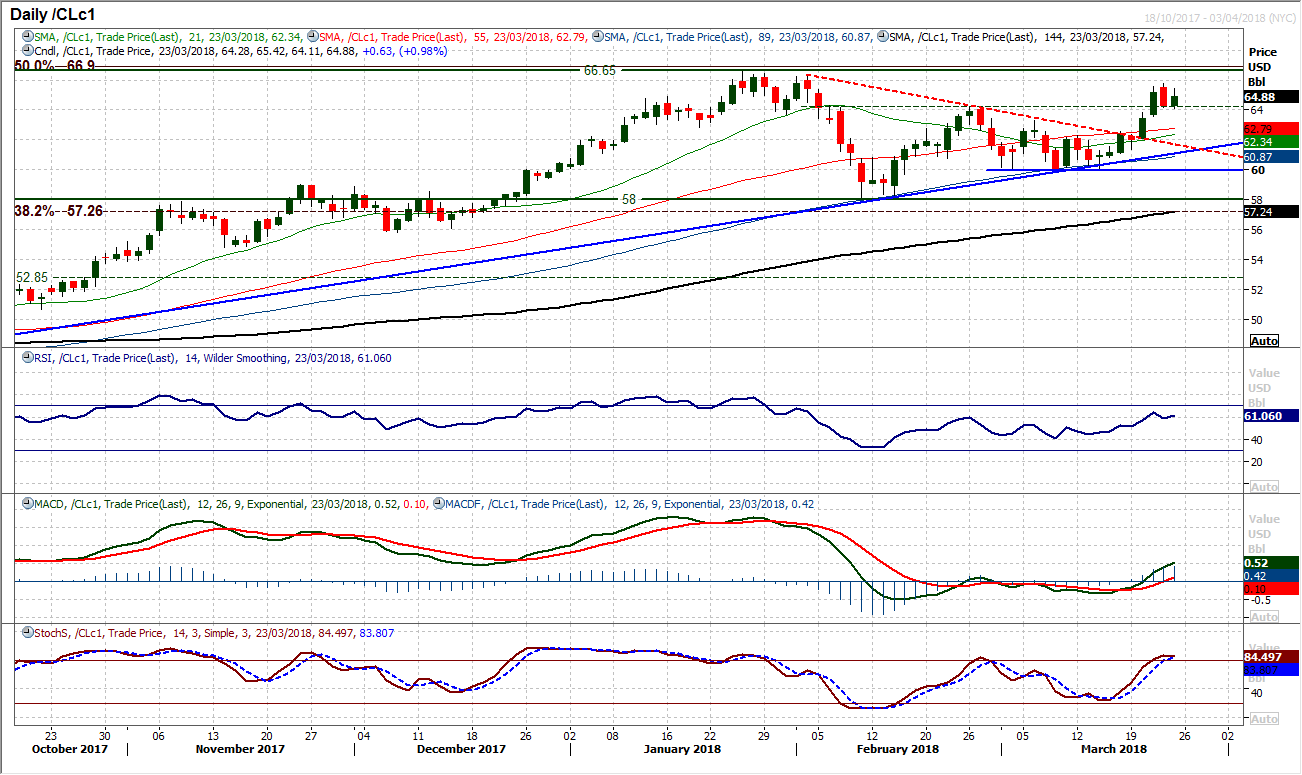
The bulls have had their strong run of the first half of the week tempered slightly following yesterday’s strong bear candle that has retraced some of the gains. However, the important move will now be how the market reacts to the support band in place between the old key breakouts at $63.30/$64.25. Early signs are positive with the market rebounding from $64.15 to build early gains today. The strong improvement in the momentum indicators may have just slipped with yesterday’s sell-off but for now the configuration remains positive. This is reflected also in the hourly chart where indicators have unwound the excess of the previous days. That makes today’s session important for the near term outlook and retains a positive configuration that would see corrections as a chance to buy. A move below the pivot at $62.50 would be needed to change the outlook, but for now the bulls maintain control.
Dow Jones Industrial Average
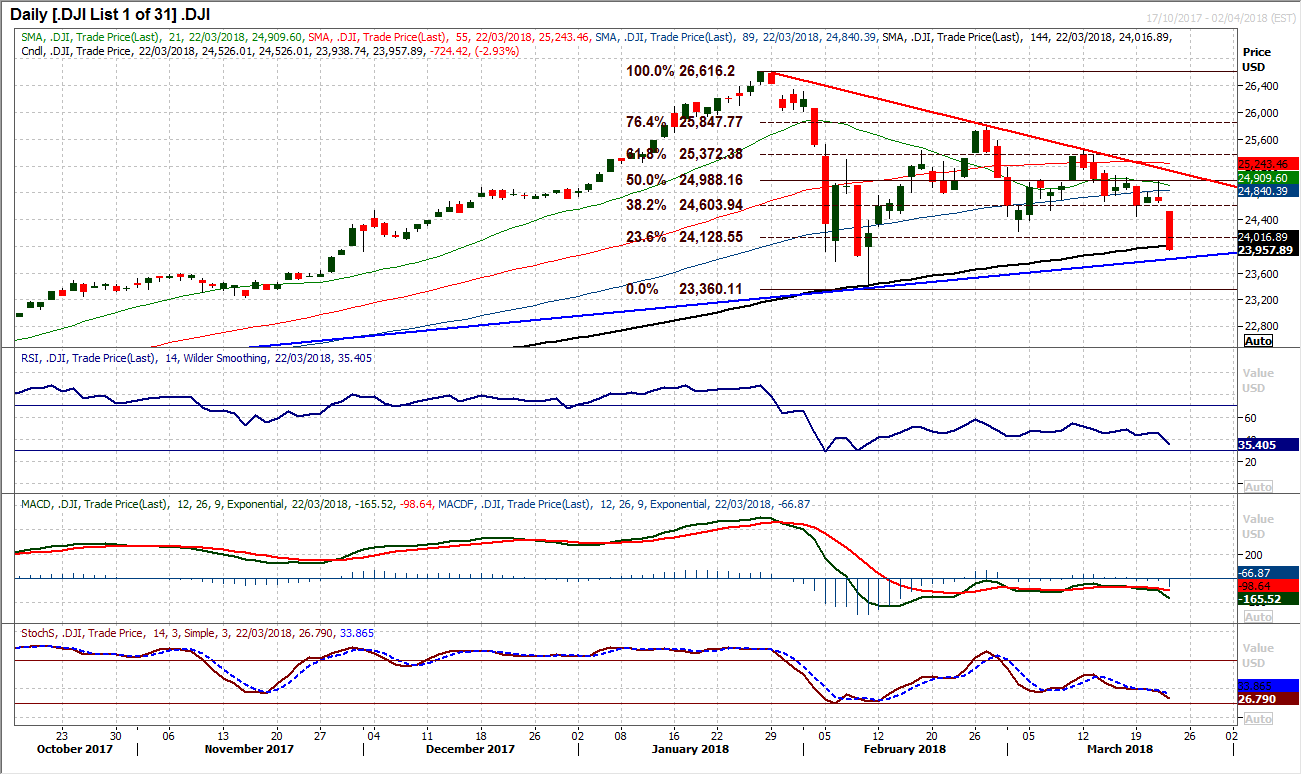
Selling pressure is mounting as the market plummeted yesterday in a huge bear candle that worryingly accelerated lower into the close. With a downtrend of the past seven weeks gathering momentum, the March low of 24,218 has also now been breached. This breakdown is confirmed across the momentum indicators with the RSI and Stochastics back at six week lows. A retreat back to test the long term trendline support of a 10 month uptrend at 23,825 today is now being threatened, whilst the market has also closed below the 144 day moving average (comes in around 24,017), a long term trend indicator, for the first time since November 2016 (when Trump was elected). The Fibonacci retracements of the February sell-off from 26,616/23,360 have consistently been key turning points (or at least consolidation) in the past six weeks and so fact that the market went straight through the 23.6% Fib retracement at 24,129 yesterday is also a big concern. With futures pointing lower again today there is a real risk of a full retracement back to 23,360. The 23.6% Fib level is a basis of resistance now at 24,219, with yesterday’s traded high at 24,562 further resistance.
Author

Richard Perry
Independent Analyst


