Oil, target at $44 remains in place

Near term crude oil outlook:
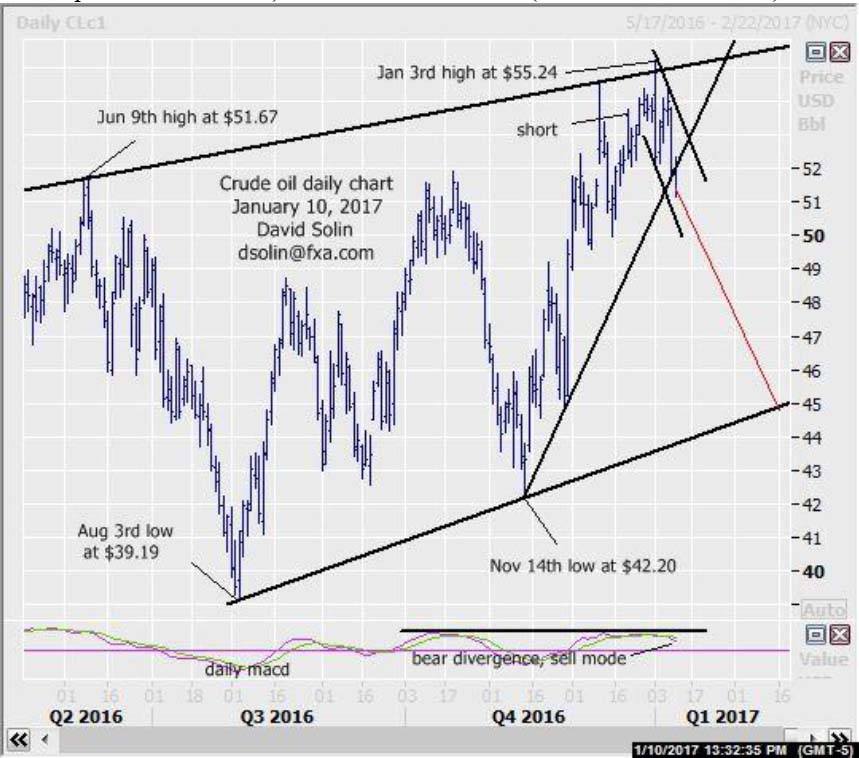
In the Jan 4th email affirmed the view of an important topping near that Jan 3rd high/rising trendline from June (ceiling of potential rising wedge, cur at $55.00/25). The market has indeed rolled over since, breaking below that bullish trendline from Nov and with eventual declines to that bullish trendline from Aug/base of the potential rising wedge (currently at $43.75/$44.00) still favored. Note too that technicals remain bearish (see sell mode on the daily). At this point there is still no confirmation of such "pattern-wise" (5 waves down for example), but any near term gains all the way back toward the highs (not currently favored) would be seen part of this larger topping. Nearby support is seen at the base of the bearish channel from the high (currently at $50.10/35) and $48.50/75 (50% retracement from Nov 14th low at $42.20). Nearby resistance is seen at the earlier broken trendline from Nov (currently at $52.00/25) and the bearish trendline/ceiling of the channel from the high (currently at $53.85/00). Bottom line: view of important top and with eventual declines to that bull trendline from Aug/base of rising wedge (currently at $43.75/00) remains.
Strategy/position:
Short from the Dec 21st sell at $53.50 and for now would stop on a close $.25 above the bear trendline/ceiling of the channel from the high. Though a break above would not abort the bigger picture bearish view, it would argue a further period of topping and would be looking to resell higher if taken out.
Long term outlook:
No change as the view of an extended period of sloppy ranging and good sized swings in both directions as the market continues to form a large, "complex" topping since June (potential rising wedge-like pattern), remains in place. As been discussing, at least another few months of these wide swings are favored (as wedges break down into 5 legs) before finally rolling over, and "fits" of the nearer term view of an important topping (see "ideal" scenario in red on weekly chart/2nd chart below). Note too that longer term technicals continue to deteriorate (see bearish divergence on the daily macd) while sloppy/rangy trade over the last few months add to this view of a "complex" topping (a characteristic). A final comment, don't forget that this is the "ideal" scenario with an upside resolution of the ceiling putting the bigger picture bearish view on hold, while a downside resolution of the base would argue a sooner rolling over/resumption of the long term decline. Further long term resistance above that rising trendline/ceiling of the potential wedge since June is seen at $59.10/35 (38% retracement from the Aug 2013 high at $112.24) and the ceiling of the bearish channel from June 2014 (cur at $62.75/25). Bottom line: potential rising wedge since June would argue another few months of large swings in both directions before finally rolling over.
Strategy/position:
With that potentially more important top seen forming, also switched that longer term bias to bearish on Dec 21st at $53.50 and using the same exit as the shorter term above.
Author

David Solin
FXA


