WTI outlook: As the year nears its end Oil remains steady

Oil prices appear to have remained relatively unchanged compared to last week. Today we are to take a look at the data of the US oil market, as well as the demand and supply side of the international oil market. For a rounder view, we are to conclude the report with a technical analysis of WTI’s daily chart.
The data of the US Oil market
Starting with the US oil market we note that last Friday, the Baker Hughes indicator showed that the number of active oil rigs in the US remained unchanged at 482. The release signaled that the increase of active US oil rigs was halted, which could be perceived as an indication of low demand, thus being releasing slightly bearish signals for oil prices. Yet on Tuesday, API changed the picture as it released a report showing a considerable drawdown of -4.7 million barrels in US oil inventories. The release implied a relative tightness of the US oil market oozing bullishness for oil prices as aggregated oil demand surpassed production levels. Furthermore the following day EIA also reported a drawdown of almost a million barrels, which was narrower than the last release, yet still stated that the US oil market remained tight. Yet the demand side may have been boosted by increased oil exports, according to EIA, practically blurring the picture for the tightness of the US oil market. Should we see more signals in the coming week that the US oil market remains tight we may see oil prices getting some support.
Oil demand expectations affected by China and the Fed
Market expectations for the demand side of the international oil market seem to have been affected by predictions for Chinese oil demand and the Fed’s interest rate decision. China's oil consumption is set to peak by 2027, state refining giant Sinopec said on Thursday, as diesel and gasoline demand weaken in the world's biggest oil importer, a slowdown that has rattled global oil markets this year. The news from China, do not seem to be promising for oil prices, on the contrary they may weigh on oil prices. Should we see further signals for an easing of Chinese oil demand we may see the news weighing on oil prices. Across the world we note that the Fed cut its interest rates by 25 basis points. The accompanying statement maintained the view that the bank is to continue to assess economic data coming in in deciding the appropriate monetary policy. Yet the bank’s projections and new dot plot tended to enhance the market’s view for an easing of the bank’s rate-cutting path. Especially Fed Chairman Powell’s press conference was deemed as more hawkish as he stated that the bank should be cautious with more rate cuts. Overall the release, highlighted the possibility of financial conditions in the US economy, not easing as much as initially hoped for by the market and in such a case we may see economic activity and consequently oil demand easing. Regarding economic activity for both China and the US we note the release of the NBS manufacturing PMI figure for December on the last day of the year and on Friday the 3rd of January we get from the US the ISM manufacturing PMI figure for the same month. Should we see a solid increase of economic activity in the manufacturing sectors of the two countries, we may see oil traders being more optimistic and oil prices getting some support.
Expectations for the production side of the international Oil market
In the production side of the international oil market, expectations may have been the key issue. We highlight OPEC+’s worries of a renewed rise in U.S. oil output when Donald Trump returns to the White House, delegates from the group said, because more U.S. oil would further erode OPEC+ market share and hamper the producer group's efforts to support prices, as per Reuters. Should we see the market adopting the worries issued by OPEC+, then we may see them having a bearish effect on oil prices as they would imply an increase of oil supply internationally, thus weighing on oil prices. On a geopolitical level, oil market worries for the crisis in the Middle East seem to have eased further at the current stage. The toppling of the Bashar Al Assad from power in Syria and his subsequent replacement, allowed for some analysts to hope for some stability in the region. Yet we maintain our doubts for the time being. In any case should we see further easing of tensions in the Middle East, it could allow for more certainty about the supply side of the international oil market thus weighing on oil prices. On the flip side, should we see tensions flare up again, increasing uncertainty in the area, we may see them have a bullish effect on oil prices.
Technical analysis
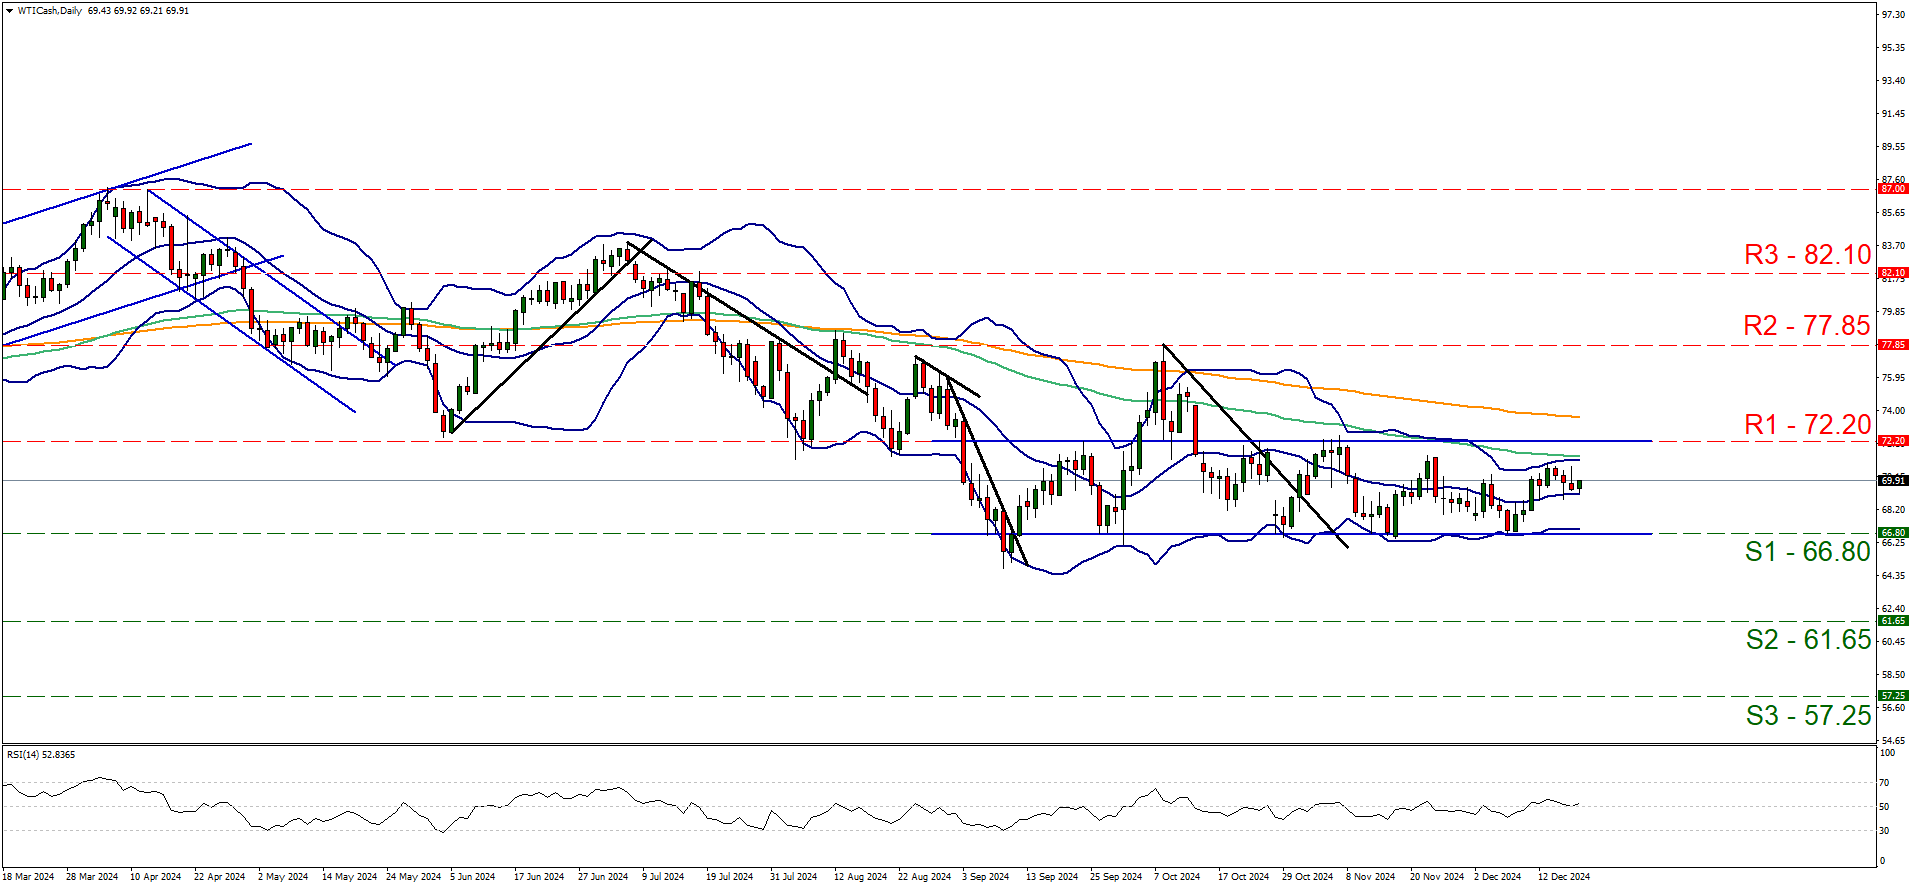
WTI Cash daily chart
Support: 66.80 (S1), 61.65 (S2), 57.25 (S3).
Resistance: 72.20 (R1), 77.85 (R2), 82.10 (R3).
WTI appears to be continuing on its sideways path, remaining confined between the 66.80 (S1) support level and the 72.20 (R1) resistance line. We opt for a sideways bias for the commodity’s price and supporting our case is the RSI indicator our chart which continues to register a figure near 50, implying a neutral market sentiment, in addition to the sideways moving channel which was incepted on the 26th of September. For our sideways bias to continue, we would require the commodity’s price to remain confined between the 66.80 (S1) support level and the 72.20 (R1) resistance line. For a bullish outlook, we would require a clear break above the 72.20 (R1) resistance line, with the next possible target for the bulls being the 77.85 (R2) resistance level. Lastly, for a bearish outlook we would require a clear break below the 66.80 (S1) support level, with the next possible target for the bears being the 61.65 (S2) support base.
Author

Peter Iosif, ACA, MBA
IronFX
Mr. Iosif joined IronFX in 2017 as part of the sales force. His high level of competence and expertise enabled him to climb up the company ladder quickly and move to the IronFX Strategy team as a Research Analyst. Mr.


