Oil market update: Tight supply meets demand destruction?
The decline in physical crude price might reflect demand strain rather than any improvement in supply conditions.
Inventory draws are cushioning the shock, but are finite and approaching critical levels.
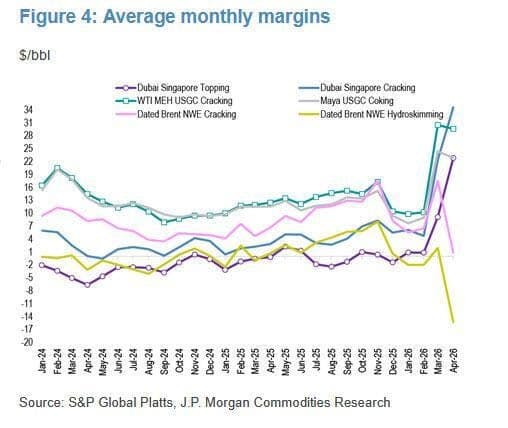
Negative refining margins signal that the system can no longer absorb higher crude costs without reducing activity.
Even with reserve releases and refinery cuts, the underlying deficit remains, leaving the market balanced between scarcity and demand fatigue.
Tight supply meets demand destruction
The oil market right now feels like a stage where the props are on fire, the script says panic, and yet the lead actor is calmly walking off in the opposite direction.
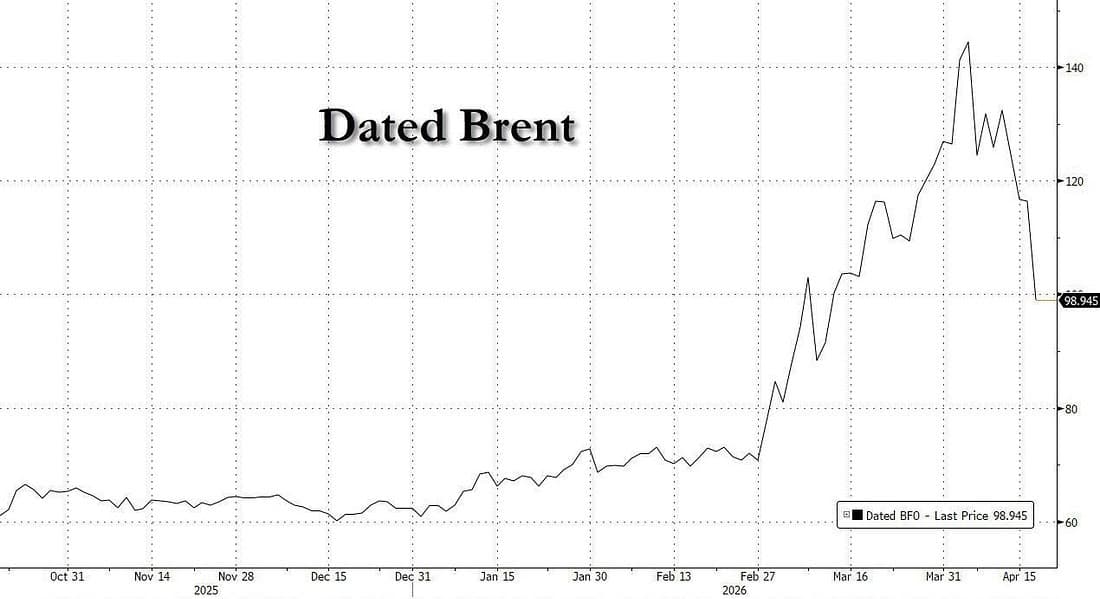
Physical crude, the real barrels that matter, not the paper promises that dominate screens, has fallen from $144 to below $100 in a matter of days. It has since tried to claw its way back, but even that rebound carries the hollow echo of a market that briefly rallied on political theatre rather than structural truth. When headlines start trading like a parody and get called out as such in real time, you know the price is no longer anchored to reality but drifting in the current of the narrative.
And that is where the confusion begins, because structurally, nothing has improved. In fact, the underlying picture has deteriorated.
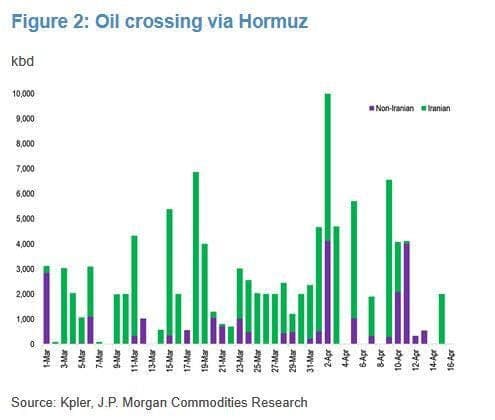
Supply has not come to the rescue. It has quietly worsened beneath the surface. Non-Iranian flows from the Gulf have held steady, but Iranian exports have effectively been taken off the board, collapsing by roughly 2 million barrels per day. That is not a marginal adjustment. That is a chunk of the system being removed. What was already a tight market has been pulled tighter, with the deficit stretching further into uncomfortable territory.
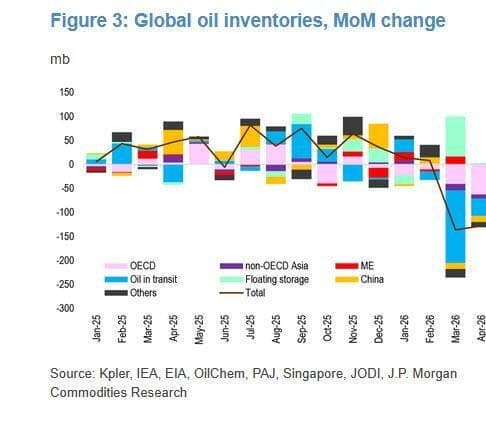
Inventories have stepped in as the shock absorber, doing what they always do in moments like this. Roughly 265 million barrels have been drawn down globally since the conflict began. That is a meaningful cushion, absorbing about 6 million barrels per day of imbalance and preventing prices from exploding higher in a straight line. But inventories are not a solution. They are a bridge. And bridges only work until you reach the other side or run out of road.
Looking ahead, the current adjustment path suggests OECD crude stocks will approach operational minimums around May 15, as refinery cuts deepen. JP Morgan
This leaves demand destruction as the only lever left to explain why prices have fallen even as the system tightens.
The market is no longer trading barrels. It is trading tolerance.
It is no longer asking how many barrels are missing. It asks how much pressure the system can absorb before it changes its behaviour. How much cost can be pushed through before something breaks? How much strain can refiners, consumers, and governments endure before they step back?
Europe is already answering that question as there is only one way to square this circle.
With supply tightening and inventories being drained, prices should be marching higher with purpose, not slipping backward. When the physical market moves in the opposite direction to its own fundamentals, it is not a signal of relief, it is a signal of strain. The only way to reconcile weaker prices with a tighter system is for demand to give way, and the clearest proof of that shift is now showing up in the refining complex.
In Northwest Europe, margins have not just softened, they have collapsed. Light sweet hydroskimming margins have gone from a healthy $9 per barrel in mid March to below zero by the end of the month, before plunging to minus $15.3 per barrel in the week ending April 12. That is not a marginal deterioration. That is the economics of refining, turning inside out.
What this tells you is simple but powerful. Refiners are no longer able to pass higher crude costs through to the end market. The consumer is resisting. The system is rejecting the price. And when that happens, refiners do not absorb losses indefinitely; they cut runs.
This is demand destruction in its earliest and most reliable form. It does not arrive as a headline collapse in consumption. It shows up quietly in margins, in utilization rates, in decisions to process less crude because it no longer makes economic sense.
So when physical crude falls in a tightening market, it is not because the shortage has disappeared. It is because the system is beginning to choke on it.
This is what demand destruction looks like in real time. Not a collapse in consumption overnight, but a gradual withdrawal. A slowing of activity as the cost of participation becomes too high.
For April, refinery cuts are already approaching 3 million barrels per day, with deeper reductions emerging across Asia and China. For May, that adjustment is accelerating toward 6 million. This is not fine-tuning. This is the system adapting under pressure.
At the same time, governments are reaching for their emergency levers. Strategic reserves are being tapped. Crude is being released. Product inventories are being drawn down. These moves are designed to smooth the shock, to extend the runway, to prevent the system from seizing under stress.
But even with these interventions, the imbalance persists. The shortfall remains wider than before.
For April, JPMorgan now estimate 2.9 mbd of refinery cuts versus 2 mbd last week—1.4 mbd in China, 1.2 mbd in the rest of Asia, and 0.3 mbd in Europe. For May, we have revised refinery cuts from 4 mbd to 6 mbd. On SPR, we are currently tracking 1.6 mbd of crude releases, including 1.0 mbd from Japan and 0.6 mbd from the US (about 0.4 mbd above our prior expectation). We also estimate 1.6 mbd of product releases/draws. Even with these offsets, the total shortfall following a full-blockade of Hormuz is now about 1 mbd larger.
And that is the paradox that defines this market.
Supply is tight. Inventories are falling. Demand is starting to bend. And price is caught in the middle, no longer reflecting just the scarcity of barrels, but the willingness of the system to endure them.
This is not a clean supply-driven rally or a clear demand-led selloff. It is a negotiation.
A negotiation between physical constraint and economic tolerance.
Because in this phase, the market is not asking how tight things are.
It is asking which side of the supply-and-demand equation takes hold of the tape again.
Author

Stephen Innes
SPI Asset Management
With more than 25 years of experience, Stephen has a deep-seated knowledge of G10 and Asian currency markets as well as precious metal and oil markets.


