Oil bulls still present after Monday’s wild swings

Oil prices correct lower yet bullish tendencies remain
Oil prices corrected lower yesterday after trying to reach the sky. Initially the market’s worries for the negative consequences of the US-Iran war on the supply side of the international oil market caused oil prices to sky rocket, yet statements of the G7 for a possible release of 400 million barrels of their strategic oil reserves to cover for any losses in oil production in the Gulf countries and in combination with Trump’s comment’s for a possible early end of the war tended to ease market worries allowing oil prices to correct lower. The movement of oil prices yesterday was exceptional, yet bullish tendencies may re-emerge, should market worries for a possible straining of the supply side of the oil market be enhanced and vice versa.
USD weakens on easing of market worries
In the FX market the USD despite opening higher yesterday and rising, relented any gains made and ended the day in the reds. The easing of the market’s worries for the war in Iran, was reflected on the safe-haven qualities of the greenback, which may be the main market driver in the FX market currently. On a macroeconomic level, we note that after the weak February US employment data, the next big test for the greenback is expected to be the release of the US CPI rates for February tomorrow and January’s PCE rates and revised US GDP rate for Q425 on Friday. Should we see the rates accelerating, implying a resilience of inflationary pressures in the US economy we may see the USD getting some support.
US stock markets recover some losses
European, Asian and US equities started the week with losses yesterday as the remnants of the market’s cautious sentiment were intense at Monday’s opening, yet as market worries about the oil market tended to ease, equities recovered their losses. Should we see signs of the US war on Iran being prolonged reversing the hopes of the market on a fundamental level, then we may see US equities retreating again.
Other highlights for today
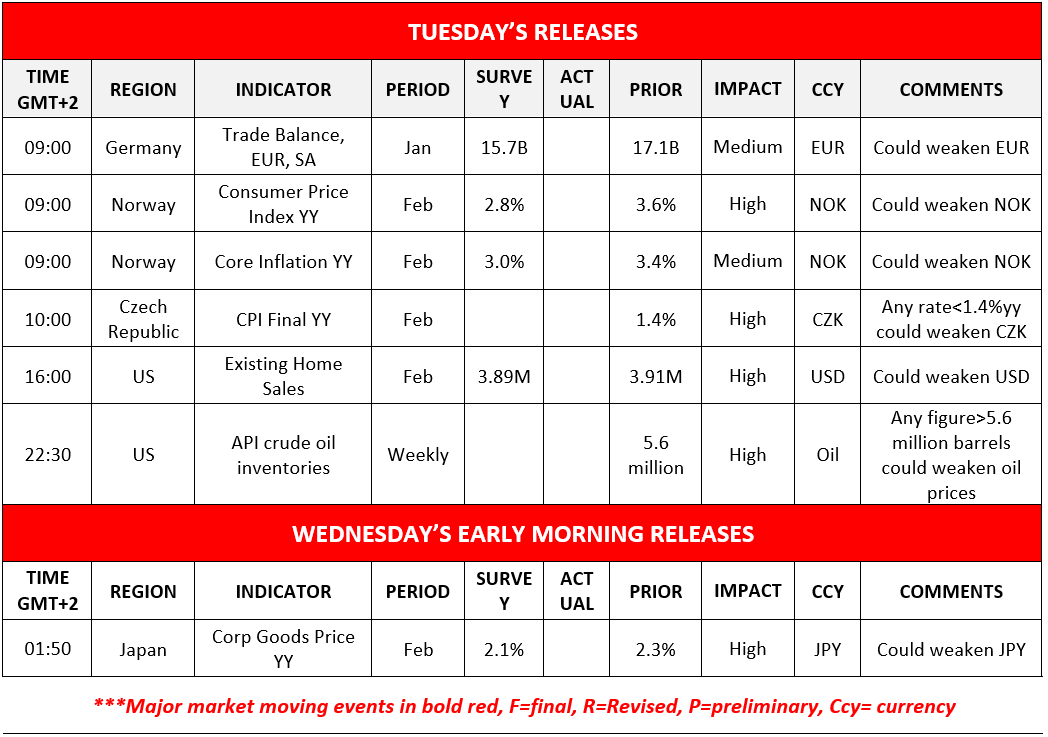
Today we get Germany’s trade data for January, Norway’s CPI rates for February, the Czech Republic’s CPI rates for the same month, the US existing home sales also for February and later on from the US we get the API weekly crude oil inventories figure. In tomorrow’s Asian session, we get Japan’s PPI rates for February.
Charts to keep an eye out
WTI’s price rallied 30%+ yesterday, at some point reaching as high as $119.50/barrel, yet relented any gains made within the same day and ended the day lower than when it started. Interestingly enough we note that during today’s Asian session the commodity’s price found new support moving higher, foreshadowing renewed bullish tendencies. Yet we also have to war that the commodity’s price is at overbought levels given the RSI indicator being above 90 and the price action being above the upper Bollinger band, which may entail a correction lower. Should the bulls maintain control over WTI’s price we may see it aiming if not breaking the 93.90 (R1) resistance line. For a bearish scenario we would require WTI’s price to break the 87.10 (S1) support line and continue even lower to break also the 83.85 (S2) support level.
Dow Jones dropped yesterday breaking the 47150 (R1) support line, yet recovered its losses and was edging higher in today’s Asian session. The market sentiment though remains bearish for the index hence despite some further upward movement we tend to remain bearish. Should the bears remain in charge of the index’s direction, we may see its price action breaking he 47150 (S1) support line clearly and moving lower. For a bullish outlook, which we currently see as remote, the index has to breach the 48350 (R1) resistance line,, breach the downward trendline which guided the price action since the 11th of February and continue higher to reach if not breach the 49600 (R2) resistance level.
Calendar follows
WTI daily chart
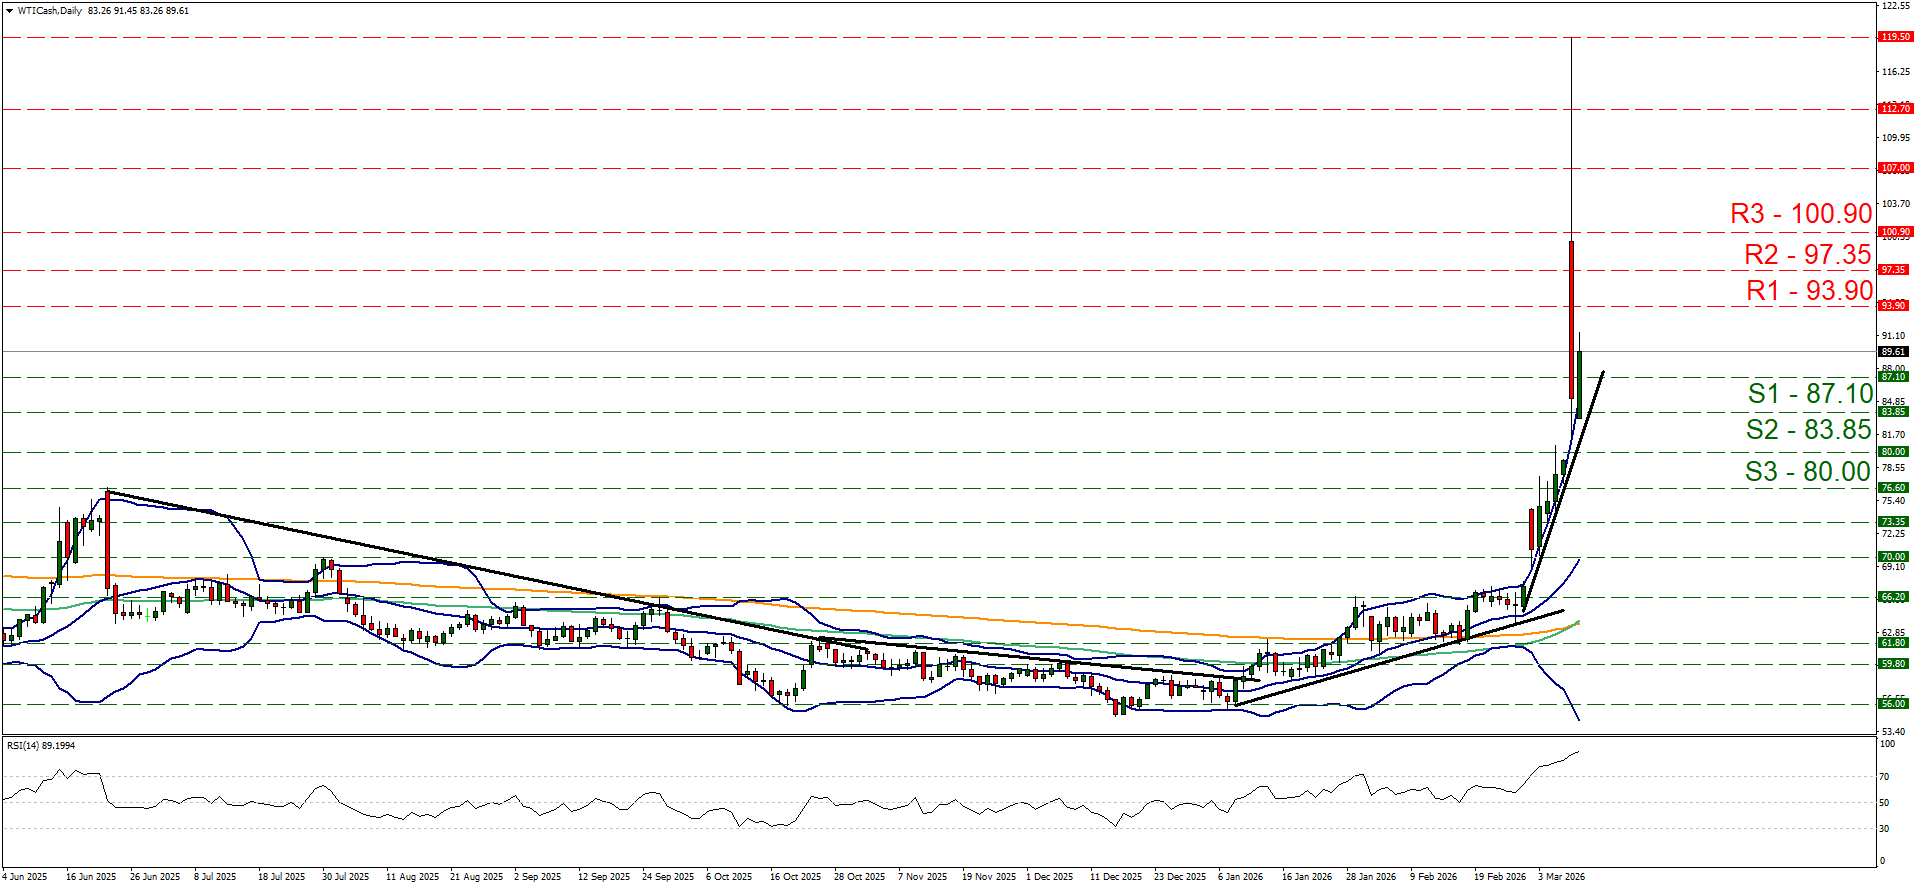
- Support: 87.10 (S1), 83.85 (S2), 80.00 (S3).
- Resistance: 93.90 (R1), 97.35 (R2), 100.90 (R3).
Dow Jones daily chart
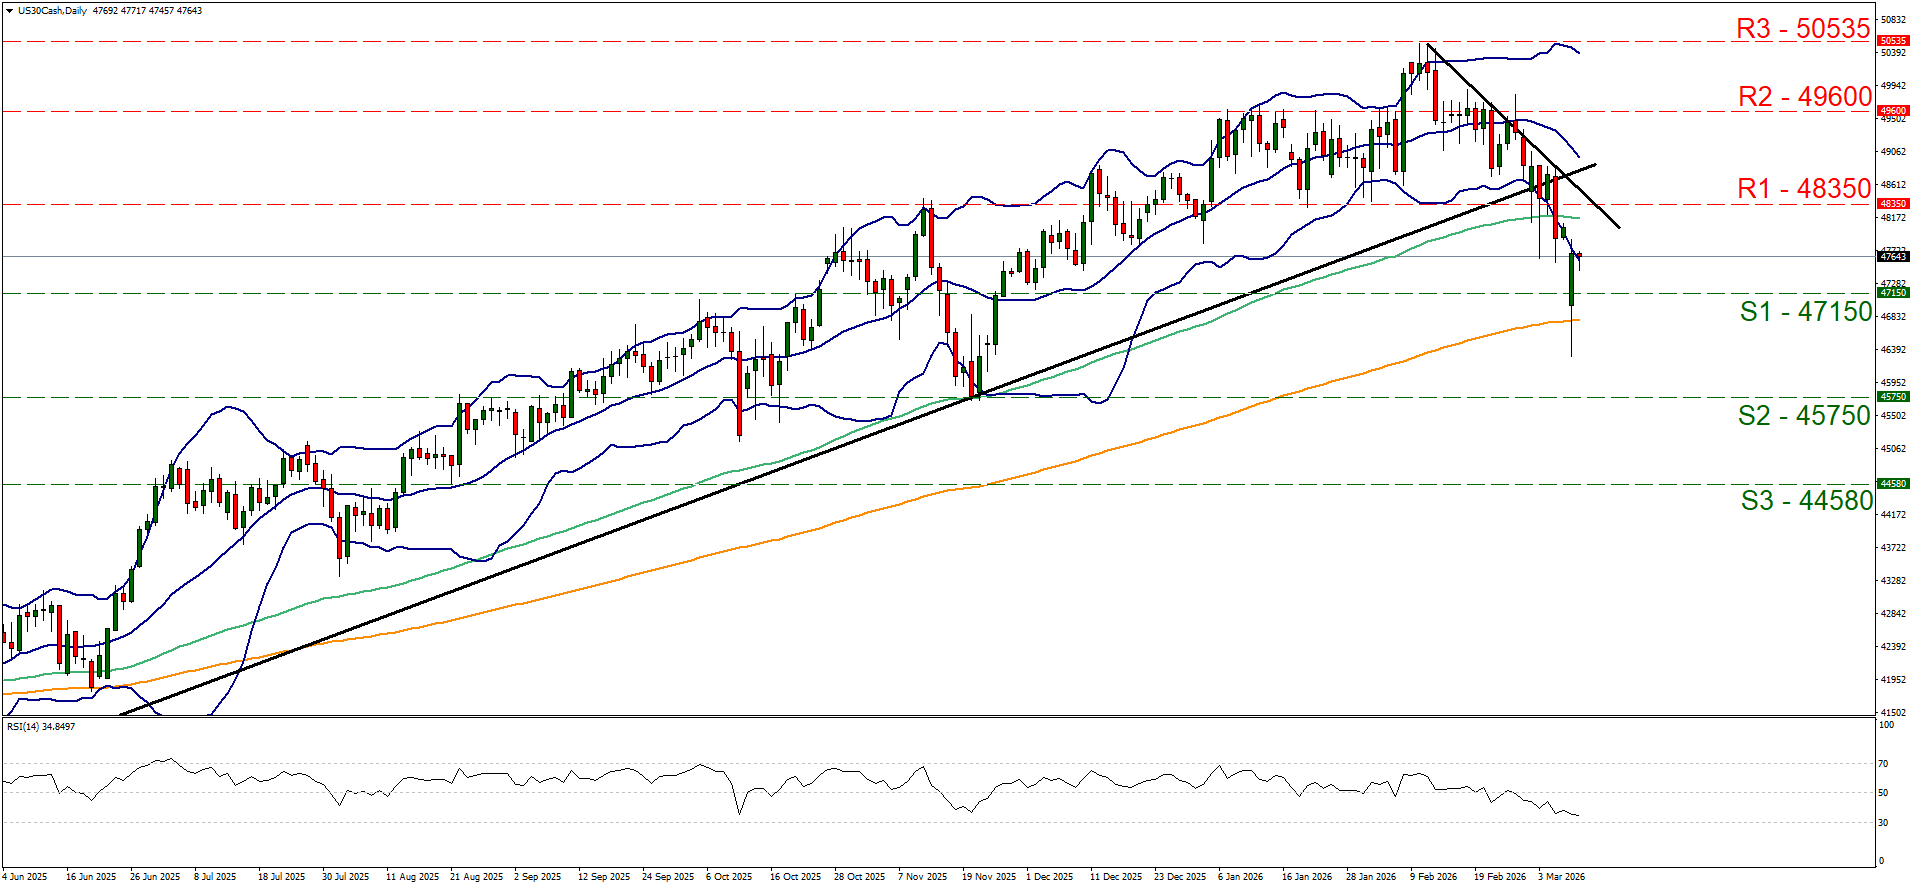
- Support: 47150 (S1), 45750 (S2), 44580 (S3).
- Resistance: 48350 (R1), 49600 (R2), 50535 (R3).
Author

Peter Iosif, ACA, MBA
IronFX
Mr. Iosif joined IronFX in 2017 as part of the sales force. His high level of competence and expertise enabled him to climb up the company ladder quickly and move to the IronFX Strategy team as a Research Analyst. Mr.














