Oil bulls’ failure and its implications

Another attempt, another failure. Is this the end of increases in black gold?
Technical picture of Crude Oil
Let’s start today’s analysis by quoting the last article on black gold:
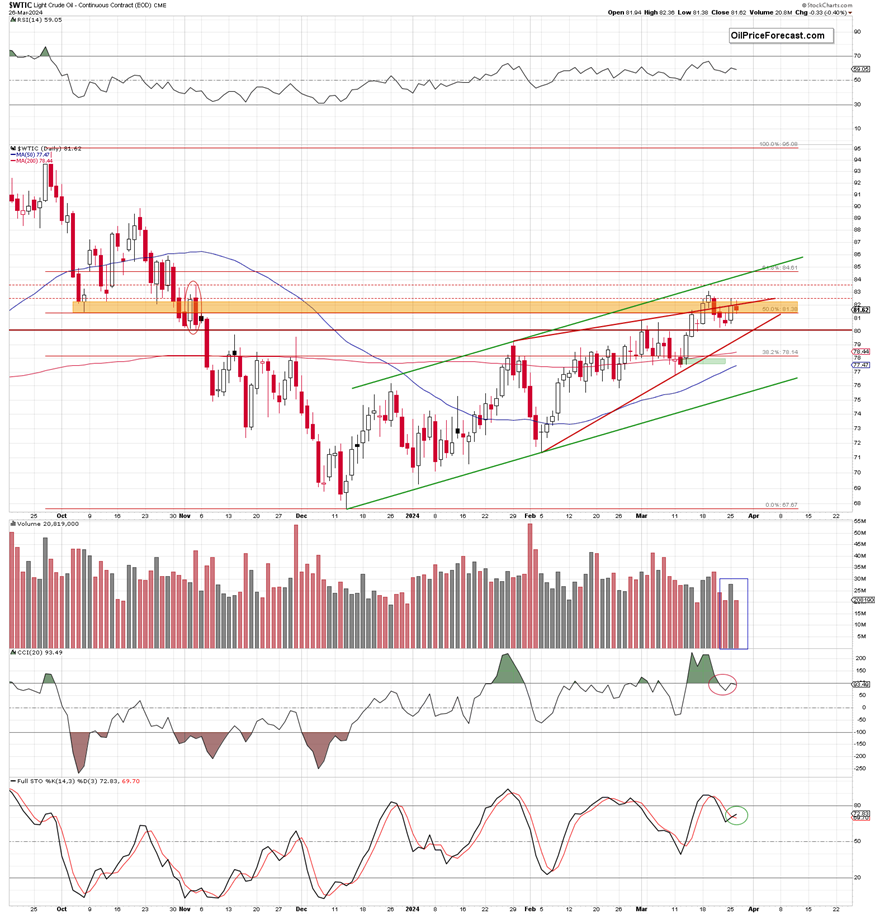
(…) light crude climbed to an intraday high of $82.48 and approached the lower border of the red gap ($82.53-$82.73) formed on Mar.20.
Despite this improvement, the bulls didn’t manage to push the price higher, which triggered a pullback and a daily closure under the previously broken upper border of the red rising wedge.
What does it mean for the commodity?
On one hand, such price action looks like a verification of the earlier breakdown under this line and could encourage the bears to show their claws once again – especially when we take into account the sell signals generated by the daily indicators.
However, on the other hand, we should keep in mind that yesterday’s upswing materialized on a visibly higher volume (compared to previous days), which suggests that the bulls could regain strength after the recent declines. In this case, another attempt to move higher and come back above the upper line of the rising wedge can’t be ruled out (…)
From today’s point of view, we see that the situation developed in line with the above scenario and the buyers pushed the price of black gold higher after the market’s open, hitting an intraday high of $82.36.
Despite this improvement, they didn’t manage to climb above the Monday’s peak (not to mention the attack on the red gap), which translated into a pullback and a daily closure under the previously broken upper border of the red rising wedge – for the second time in a row.
Although this is a negative development, yesterday’s move materialized on a visibly lower volume than the earlier increase, which suggests that the bears may not be as it may seem at a first glance.
Additionally, the Stochastic Oscillator generated a buy signal, which together makes the very short-term picture a bit unclear. Why? On the one hand, we have had two unsuccessful attempts to come back above the red rising wedge (a bearish development). On the other hand, however, the volume suggests and the daily indicator suggest that the bulls may want to try one more time to climb above the formation in the coming day(s).
Waiting at the sidelines
Summing up, although crude oil moved slightly higher after yesterday’s open, the commodity finished the day under the nearest major resistance – the upper border of the red rising wedge. Although this is a negative signal, the current picture that emerges from the 4-hour chart in combination with a disappointing volume during yesterday’s session (it didn’t confirm oil bears’ strength) suggests that the bulls may make another attempt to break through it in the coming session. Taking all the above into account, it seems that waiting at the sidelines for more clear clues about the next move is a good idea.
Want free follow-ups to the above article and details not available to 99%+ investors? Sign up to our free newsletter today!
Want free follow-ups to the above article and details not available to 99%+ investors? Sign up to our free newsletter today!
Author

Anna Radomska
Gold Price Forecast
Anna's passion for drawing evolved into a fascination with colorful lines and shapes, which later inspired her interest in the stock market.


