Oil and Gold: Price review for the week ahead

This preview of weekly data examines USOIL and XAUUSD, with economic data expected later this week as the primary market drivers of the near-term outlook.
Highlights of the week: RBA meeting minutes, US PCE and GDP, Canadian GDP
Tuesday
RBA meeting minutes at 01:30 AM GMT. These are published 2 weeks after the interest rate decision. They give full detail of the discussions and the different views, and record the votes of the members of the committee. This could spark some volatility on the Australian dollar and the instruments traded against it.
Wednesday
US core PCE, expected to be released at 12:30 PM GMT, is anticipated to increase by 0.1% for July. The PCE index shows the changes in the price of goods and services bought by consumers for consumption, and it excludes food and energy. The PCE reading is one of the vital components the Federal Reserve considers when deciding on its monetary policy, and an increase in the Index could prompt a more hawkish stance at the Fed's next meeting.
US GDP growth 2nd estimate for the second quarter of 2026 is expected to decline to 1.5% against the previous figure of 2.1%. If these rather pessimistic expectations are met, then it might create some minor losses for the Dollar while supporting many of its instruments traded against it.
Friday
The Canadian GDP growth rate for the second quarter is at 13:30 GMT. The yearly figure is expected to increase from -0.1% to 3.4% while the quarter-over-quarter is expected to also increase from 0% to 0.8%. If these data are confirmed, then the loonie could gain in the short term against its pairs.
Federal Reserve Chair Kevin Warsh will deliver a keynote speech at the annual Jackson Hole Economic Policy Symposium in Wyoming on Friday, at 14:00 GMT. Markets will be closely watching his remarks for clues on U.S. inflation, bond market risks, and the future direction of interest rates.
USOil, daily
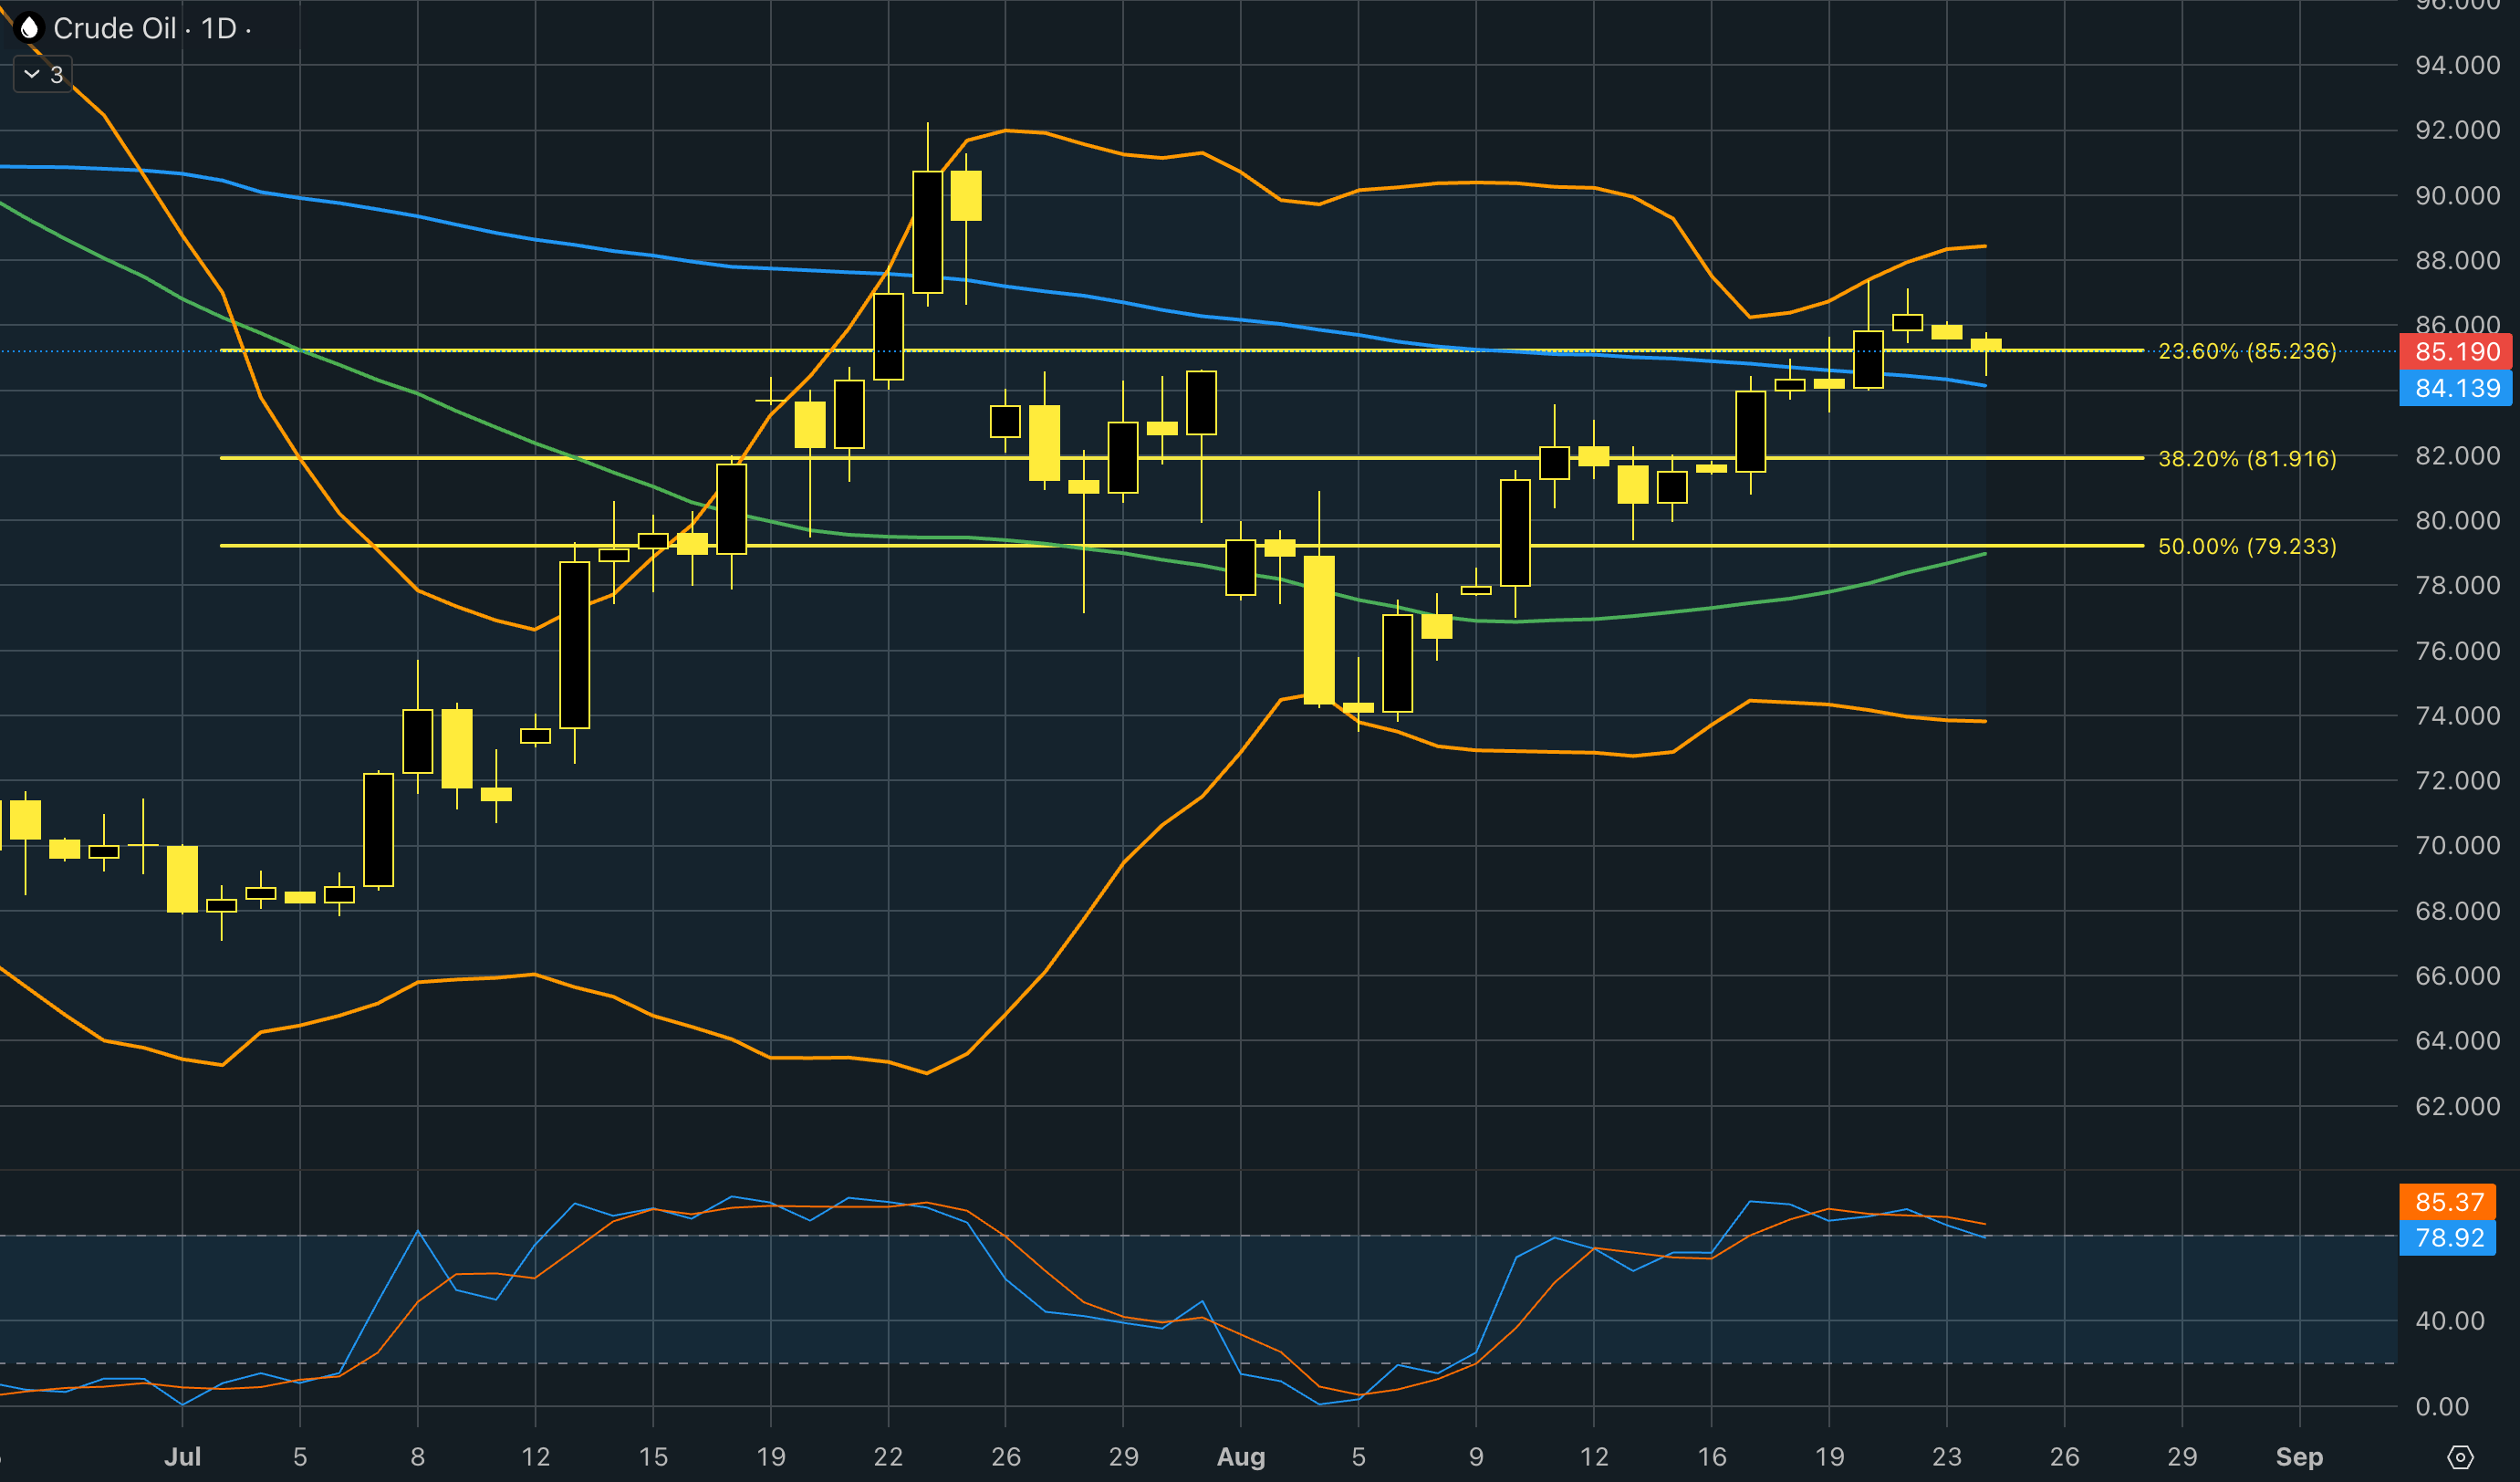
Oil prices fell after two weeks of gains as traders awaited details of the US plan to economically isolate Iran. The market has gained more than 50% this year as the US-Iran war disrupts global crude and refined-product supplies, though uncertainty remains over how far Washington can escalate pressure without triggering further disruptions. Higher prices are also weighing on demand, with China’s Sinopec reporting an almost 8% drop in gasoline consumption and a 12% decline in diesel use in the first half of the year. Meanwhile, shipping through the Strait of Hormuz remains restricted, while disruptions around the Bab el-Mandeb are forcing Saudi Arabia to use longer routes. In Russia, uncertainty over diesel exports and ongoing tensions around Black Sea shipping add further pressure to an already disrupted energy market.
From a technical perspective, crude oil remains in a short-term bullish trend, with price trading above both the 50-day and 100-day SMAs, while currently testing the 23.6% Fibonacci retracement near $85. The Stochastic oscillator is in overbought territory, suggesting the recent rally may be losing momentum and could be vulnerable to a short-term pullback. Price is also approaching the upper Bollinger Band around $88, indicating that the market is becoming increasingly stretched. A decisive break above $85 could open the way toward the $88–90 area, while a rejection could bring prices back toward the $82 and $79 Fibonacci support levels. Overall, the technical bias remains bullish, but overbought conditions point to an elevated risk of consolidation or a corrective move.
Gold-Dollar, daily
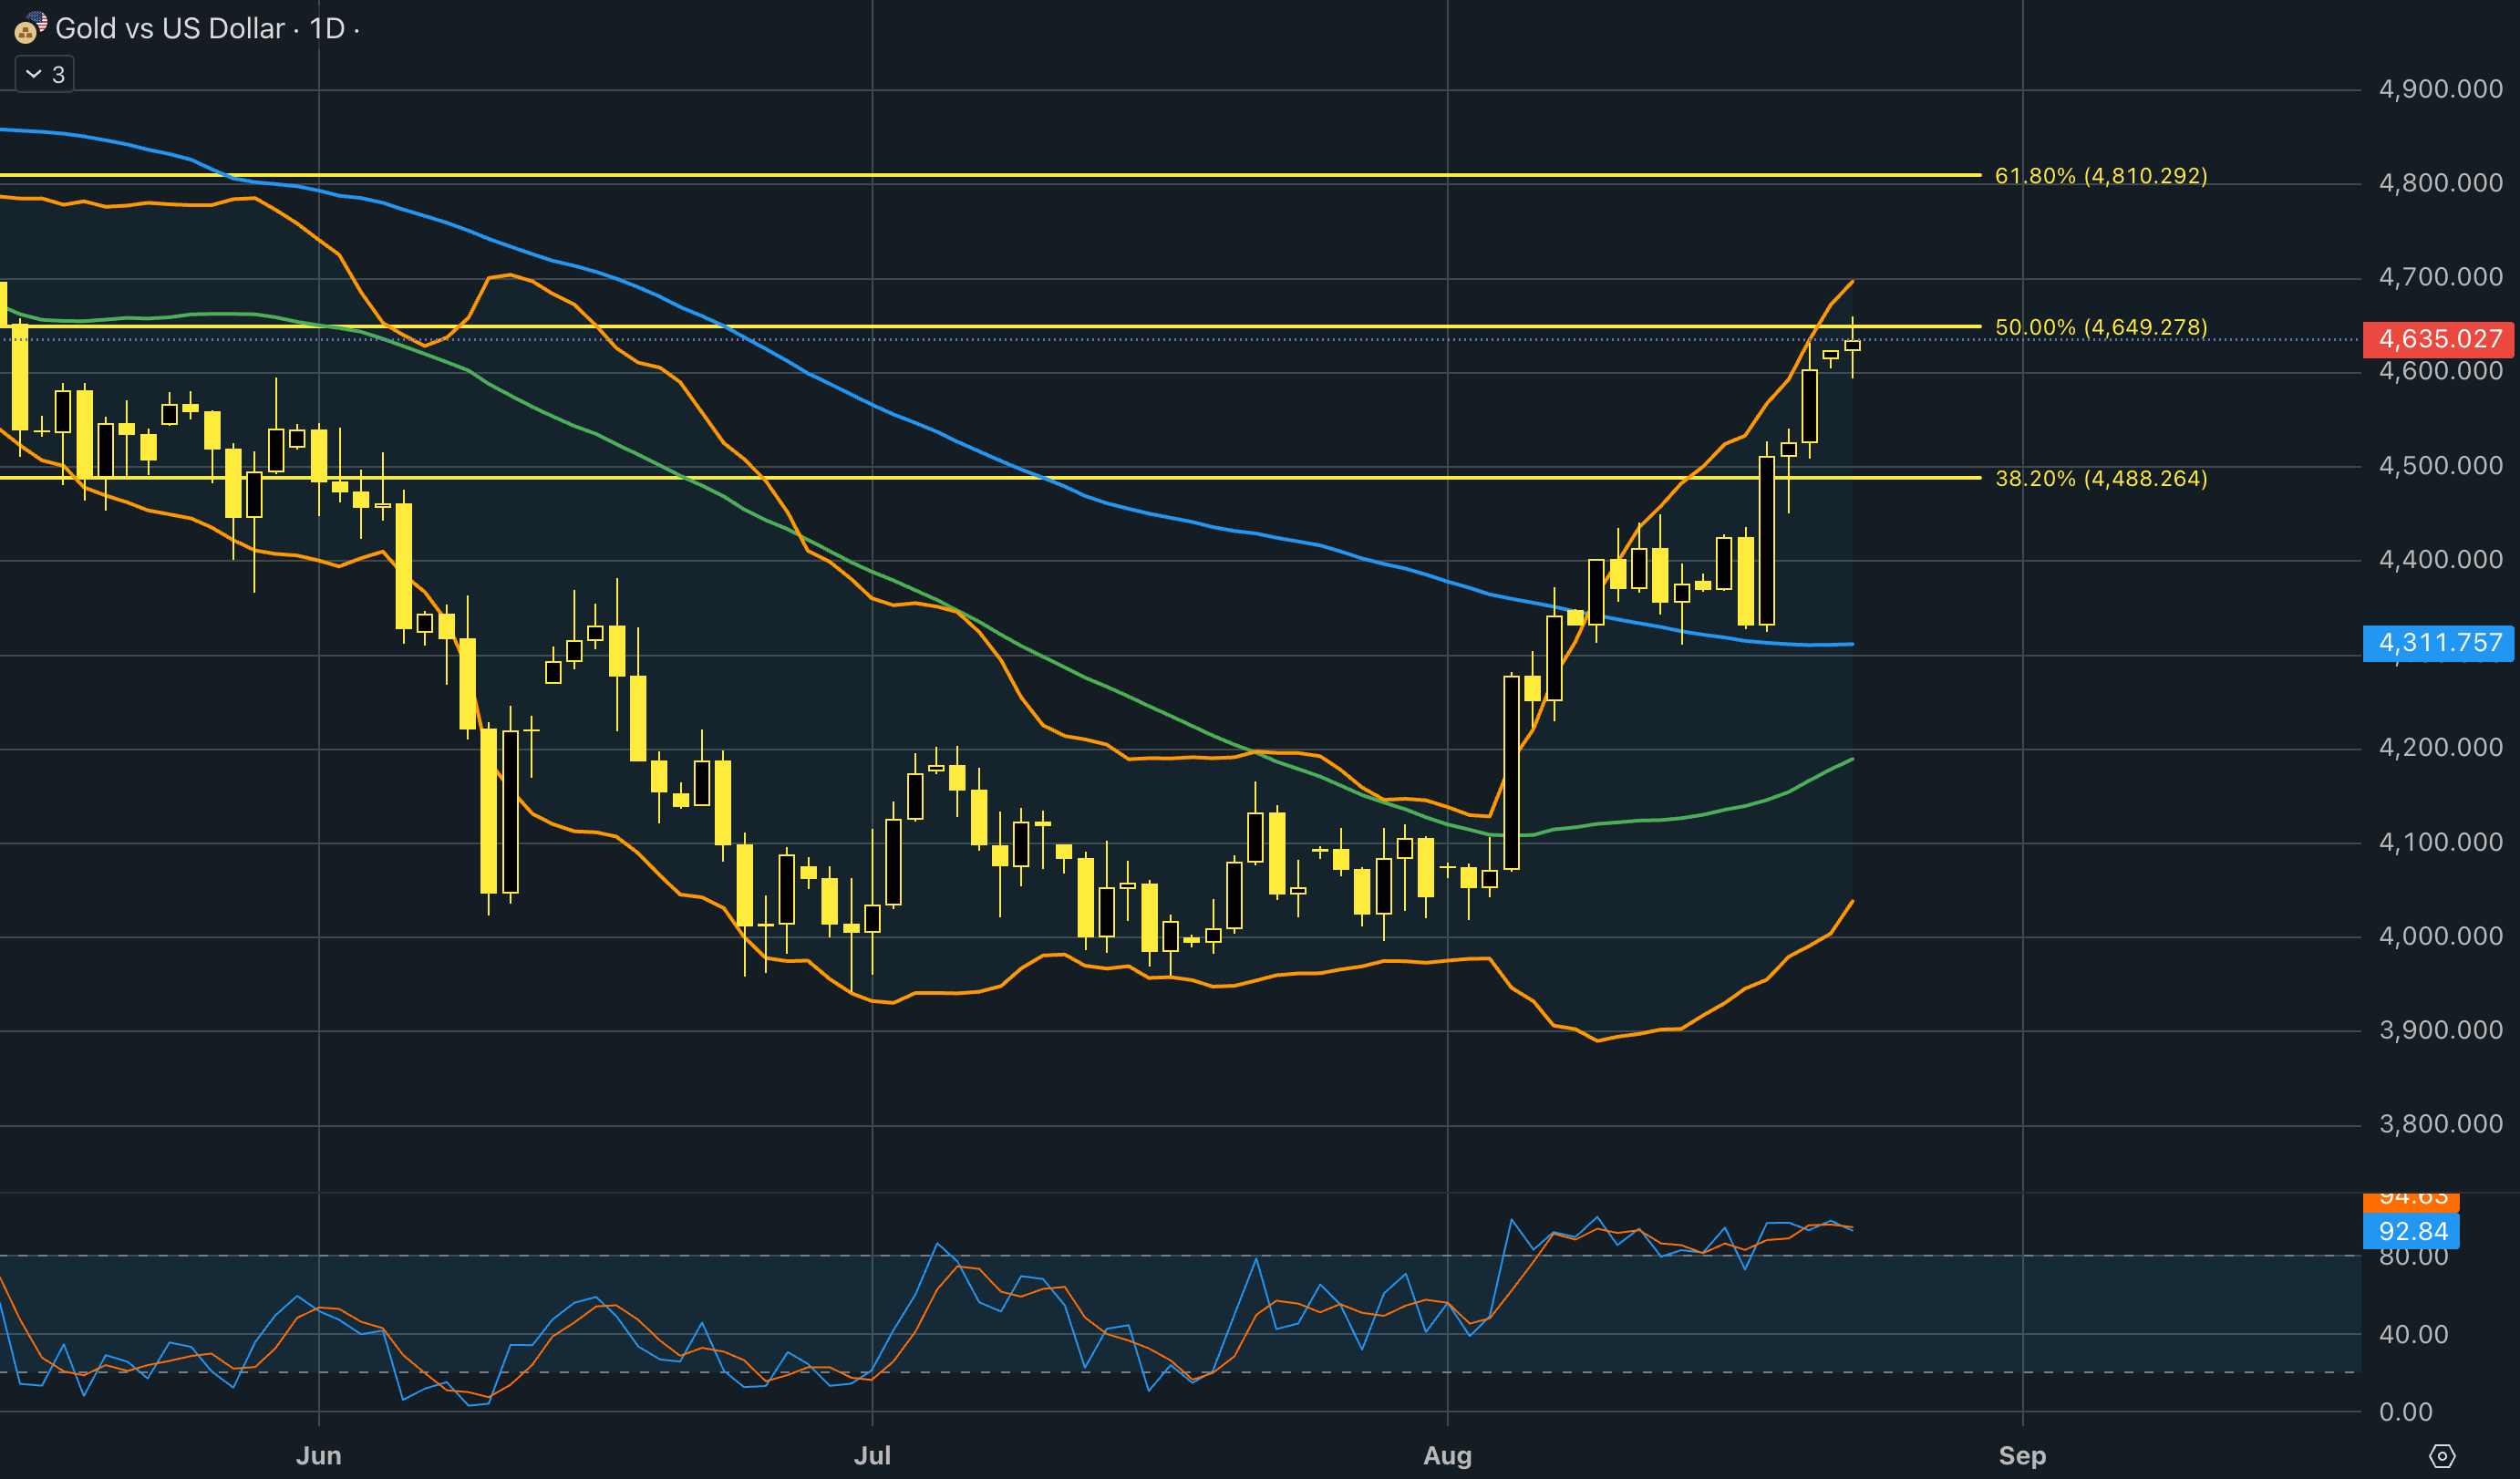
Gold climbed to its highest level in more than three months, rising above $4,650 an ounce as US Treasury intervention in the bond market pushed yields and the dollar lower. The move revived concerns over currency debasement and encouraged investors to seek alternatives such as gold. Gold-backed ETFs also recorded their strongest weekly inflows since January, signalling broader investor participation. Meanwhile, Ray Dalio urged investors to reduce bond exposure and allocate as much as 15% to gold as a hedge against the risk of a US debt crisis. However, a renewed rise in US real yields or the dollar remains a key near-term risk for the metal.
From a technical point of view, gold has strengthened significantly, breaking above the 38.2% Fibonacci retracement at $4,488 and now testing the 50% level around $4,649, which is the key resistance area. Price is trading well above both the 50-day and 100-day SMAs, confirming a strong bullish trend, while the widening Bollinger Bands reflect increasing volatility. However, the Stochastic oscillator is deeply overbought, suggesting the rally is becoming stretched and could face a short-term correction or consolidation. A decisive break above $4,649 could open the way toward the 61.8% Fibonacci level near $4,810, while a rejection could bring the price back toward $4,490. Overall, the technical outlook remains bullish, although overbought conditions warrant caution around current levels.
Author

Antreas Themistokleous
Exness
Antreas has been trading CFDs since 2018 using a combination of fundamental and technical analysis.