Oil and Gold: Price review for the week ahead

This preview of weekly data examines USOIL and XAUUSD, with economic data expected later this week as the primary market drivers of the near-term outlook.
Highlights of the week: US PCE and GDP growth, German inflation, Canadian GDP
Thursday
- US core PCE at 12:30 PM GMT. The market is expecting this figure to remain stable at 0.3% for April, but if any surprise is seen at the time of publication would most probably create volatility in the majority of the dollar pairs.
- US GDP growth at 12:30 PM GMT. The market consensus is that the figure will increase by 1.5% for the first quarter. This might not have a major effect on the dollar since it is just a second estimate, but it could hint that the official GDP rate might be increased for the quarter and that the greenback might be up for a bullish move once the official rate is released.
Friday
- Preliminary German inflation rate at 12:00 PM GMT. The market consensus for May is for the figure to remain static at 2.9%; however, any significant deviation from the actual publication could most probably influence the European inflation figure at their next meeting.
- The Canadian GDP growth rate for the first quarter is at 12:30 PM GMT. The yearly figure is expected to increase from -0.6% to 1.5%, while the quarter-over-quarter is expected to also increase from -0.2% to 0.1%. If these data are confirmed, then the loonie could gain in the short term against its pairs.
USOIL, daily
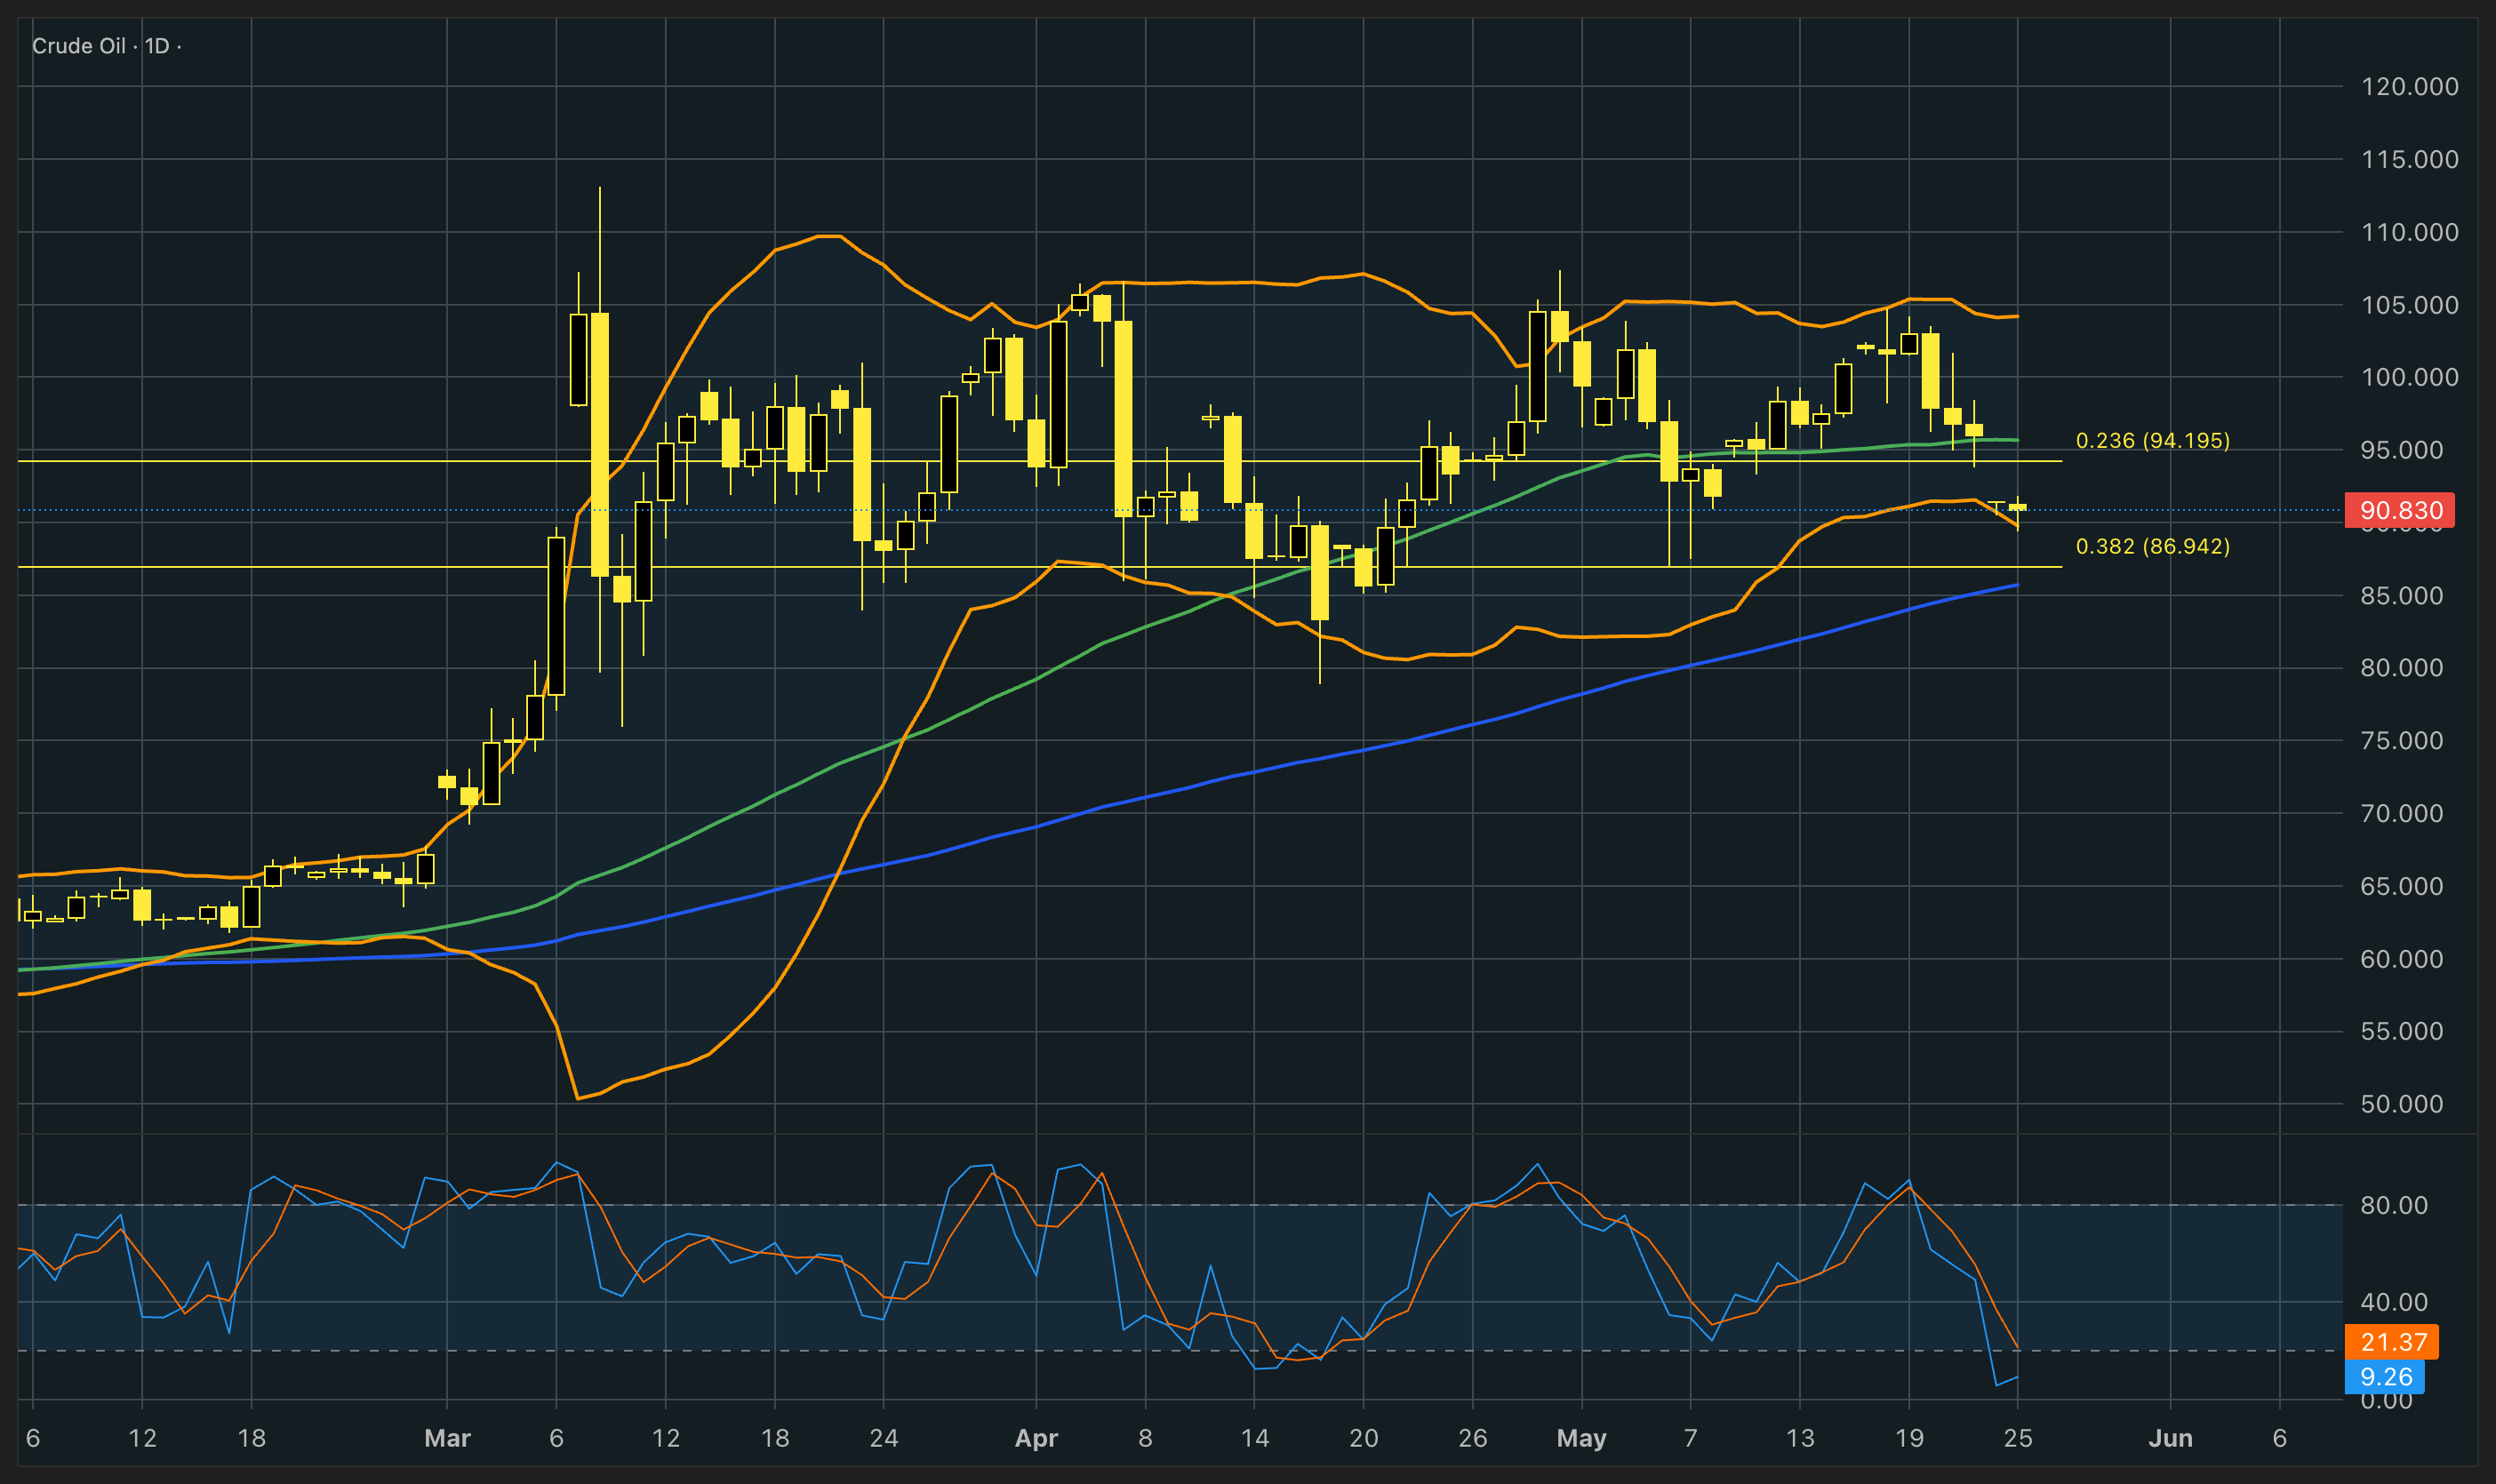
Oil prices fell sharply after Marco Rubio and Donald Trump signaled progress in talks with Iran that could eventually reopen the Strait of Hormuz and ease supply disruptions. Markets reacted to signs that diplomacy is still alive, although major issues remain unresolved. markets are now pricing out some of the extreme geopolitical risk premium that had built up during the conflict, but caution that a lasting resolution is still far from guaranteed. The Strait of Hormuz remains heavily disrupted under the ongoing US-Iran standoff, though limited tanker traffic has resumed. A temporary 60-day ceasefire extension is reportedly being discussed as part of ongoing negotiations, with plans to reopen and de-mine the strait during that period. Even so, markets remain sensitive to any sign that talks could break down again.
Crude opened with a bearish gap in the Asian session and is now pressing against the lower Bollinger Band near $90, signalling continued downside pressure. Below that, the $87 zone stands out as a key support area, reinforced by the 38.2% Fibonacci retracement and the 100-day moving average. Momentum is stretched, with the Stochastic in deeply oversold territory after the recent selloff. At the same time, widening Bollinger Bands suggest volatility is picking up, so sharp moves in either direction remain possible. From a purely technical perspective, $87 could act as a strong floor in the short term. However, any shift in geopolitical headlines or a resolution in tensions could override the setup and drive prices lower despite the support structure.
Gold-Dollar, daily
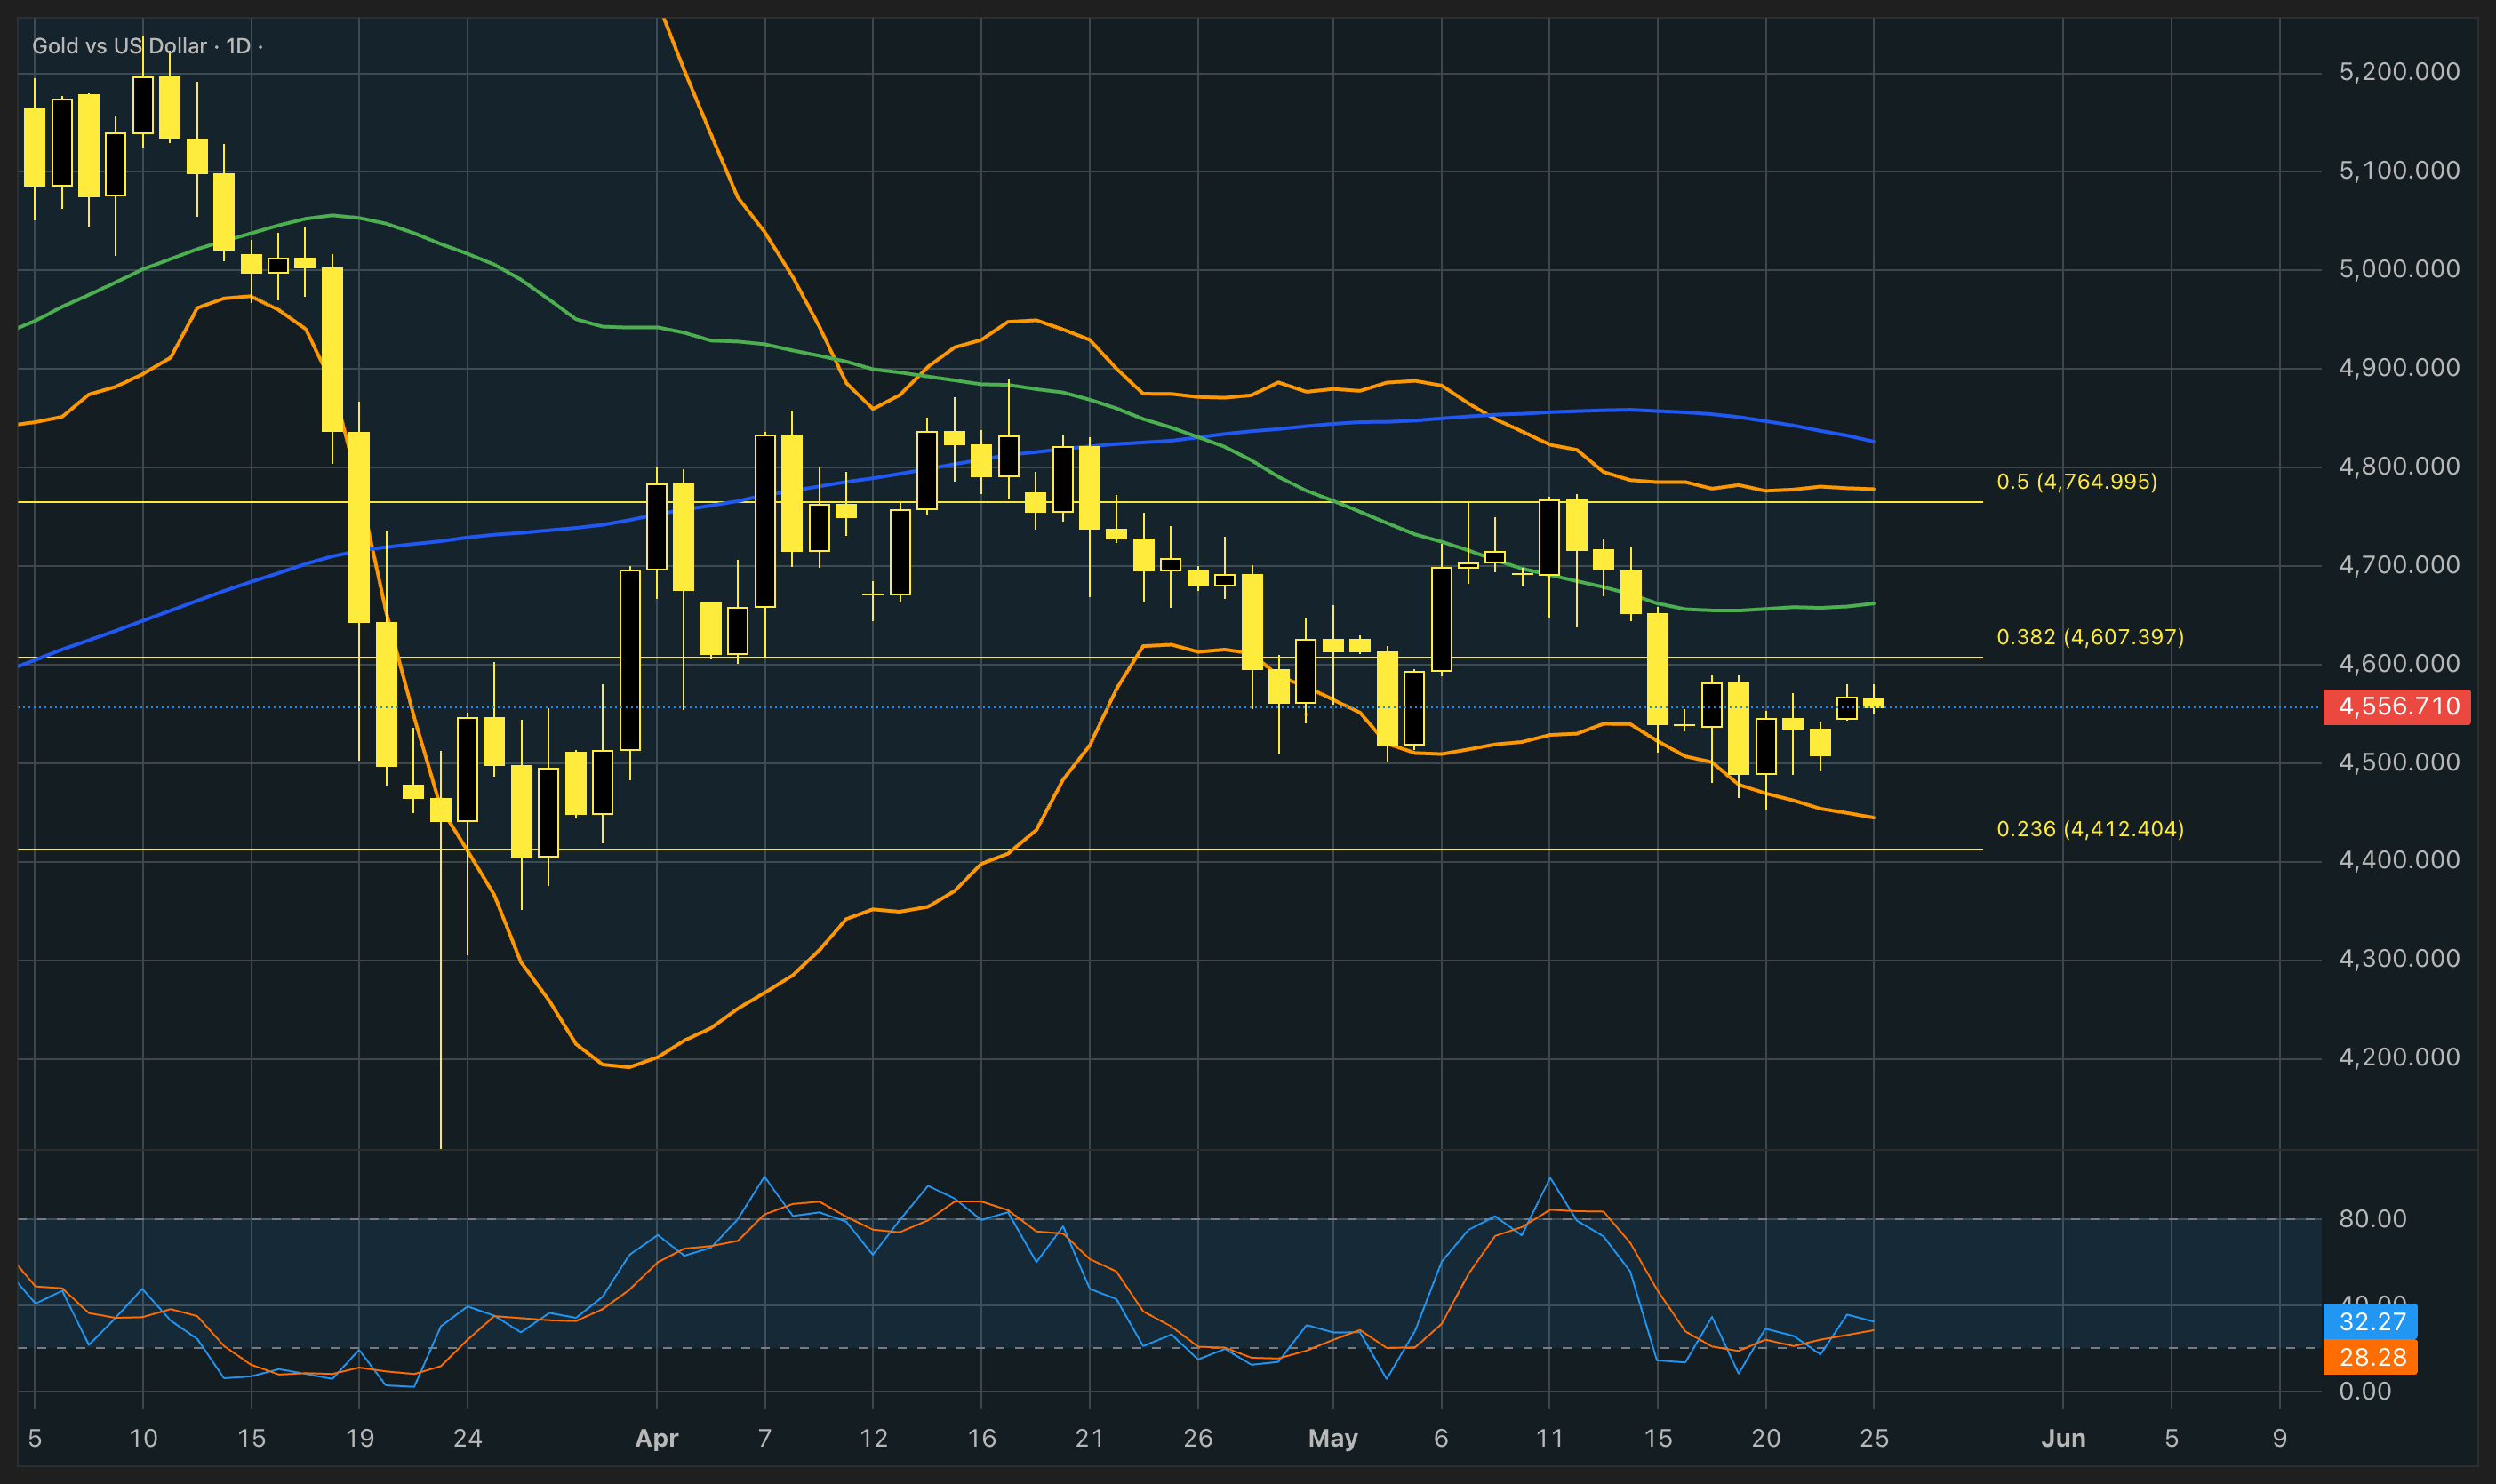
Gold moved higher as signs of progress in US-Iran negotiations eased some inflation concerns linked to the Strait of Hormuz crisis. Marco Rubio said there could be “good news” soon, while Donald Trump said talks were continuing but warned he would not rush into a final agreement. Despite the rebound, markets are still skeptical of headline-driven optimism after several previous negotiation breakthroughs failed to produce lasting results. Key issues, including Iran’s nuclear program, also remain unresolved. Gold is still sharply lower since the conflict began earlier this year, as surging energy prices fueled expectations of higher interest rates. Investors are now watching the Federal Reserve closely under new chair Kevin Warsh for signals on the future direction of monetary policy.
From a technical point of view, the gold price has rebounded on the support of the lower band of the Bollinger Bands and has since corrected to the upside. The Stochastic has returned to neutral territory, suggesting price action could develop in either direction, while the wider Bollinger Bands indicate enough volatility for larger short-term moves. However, the moving averages continue to point to a broader bearish trend, with no strong signs of a sustained bullish reversal for now. In the near term, the price may remain range-bound until a fresh catalyst drives momentum.
Author

Antreas Themistokleous
Exness
Antreas has been trading CFDs since 2018 using a combination of fundamental and technical analysis.