Market says no to the upside

USD: Jun '24 is Down at 105.705.
Energies: Jun '24 Crude is Down at 81.33.
Financials: The June '24 30 Year T-Bond is Up 3 ticks and trading at 114.30.
Indices: The Jun '24 S&P 500 emini ES contract is 48 ticks Higher and trading at 5074.25.
Gold: The Jun'24 Gold contract is trading Up at 2398.30.
Initial conclusion
This is not a correlated market. The USD is Down and Crude is Down which is not normal, but the 30 Year T-Bond is trading Higher. The Financials should always correlate with the US dollar such that if the dollar is Higher, then the bonds should follow and vice-versa. The S&P is Higher and Crude is trading Lower which is correlated. Gold is trading Higher which is correlated with the US dollar trading Down. I tend to believe that Gold has an inverse relationship with the US Dollar as when the US Dollar is down, Gold tends to rise in value and vice-versa. Think of it as a seesaw, when one is up the other should be down. I point this out to you to make you aware that when we don't have a correlated market, it means something is wrong. As traders you need to be aware of this and proceed with your eyes wide open. Asia is trading Higher with the exception of the Indian Sensex. Currently all of Europe is trading Higher.
Possible challenges to traders
-
Unemployment Claims is out at 8:30 AM EST. This is Major.
-
Philly Fed Manufacturing Index is out at 8:30 AM EST. This is Major
-
FOMC Member Bowman Speaks at 9:15 AM EST. This is Major.
-
FOMC Member Williams Speaks at 9:15 AM EST. This is Major.
-
Existing Home Sales is out at 10 AM EST. This is Major.
-
CB Leading Index m/m is out at 10 AM EST. This is Major.
-
Natural Gas Storage is out at 10:30 AM EST. This is Major.
-
FOMC Member Bostic Speaks at 11 AM EST. This is Major.
Treasuries
Traders, please note that we've changed the Bond instrument from the 30 year (ZB) to the 10 year (ZN). They work exactly the same.
We've elected to switch gears a bit and show correlation between the 10-year bond (ZN) and the S&P futures contract. The S&P contract is the Standard and Poor's, and the purpose is to show reverse correlation between the two instruments. Remember it's likened to a seesaw, when up goes up the other should go down and vice versa.
Yesterday the ZN migrated Higher at around 10 AM EST as the S&P hit a High at around the same time. If you look at the charts below the S&P gave a signal at around 10 AM and the ZN started its Upward climb. Look at the charts below and you'll see a pattern for both assets. S&P hit a High at around 10 AM and migrated Lower. These charts represent the newest version of MultiCharts and I've changed the timeframe to a 30-minute chart to display better. This represented a Long opportunity on the 10-year note, as a trader you could have netted about a dozen ticks per contract on this trade. Each tick is worth $15.625. Please note: the front month for both the ZN and the S&P are now Jun '24. I've changed the format to filled Candlesticks (not hollow) such that it may be more apparent and visible.
Charts courtesy of MultiCharts built on an AMP platform

ZN -Jun 2024 - 04/17/24
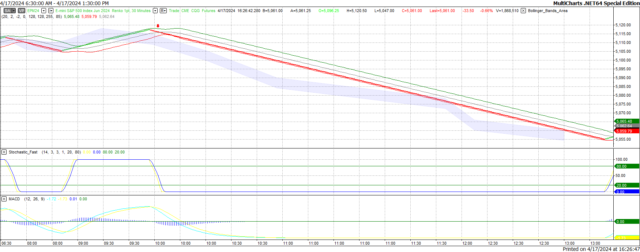
S&P - Jun 2024 - 04/17/24
Bias
Yesterday we gave the markets an Upside bias as the indices showed market correlation to the Upside Wednesday morning. The markets however had other ideas as the Dow dropped 46 points and the other indices lost ground as well. Today we aren't dealing with a correlated market and our bias is Neutral.
Could this change? Of Course. Remember anything can happen in a volatile market.
Commentary
Yesterday we suggested an Upside bias as the markets were correlated to the Upside Wednesday morning. Initially the markets did trade Higher but after 11 AM EST it was clear that the markets had other ideas. What could have caused this? A number of factors actually. President Biden suggesting three times the tariffs for Chinese steel. The markets don't like the word tariff because inevitable it leads to higher prices for us. The ongoing conflict in the Middle East and the Ukraine isn't making anyone feel better. Today we far more on the dockets in terms of economic reports among them Philly Fed Manufacturing Index. It is hoped that these reports can serve to move the markets Higher but as in all things, only time will tell.
Author

Nick Mastrandrea
Market Tea Leaves


