Japanese Yen faces near-term COT pressure while copper reaches an all-time extreme

A 49% weekly shift in Commercial net positioning points to near-term weakness in the Japanese yen, even as a previous bullish extreme still matters on a longer horizon. Copper and soybeans have also reached all-time COT extremes, while Natural Gas remains historically stretched on the bullish side.
The Japanese yen is sending different signals across timeframes
The Japanese yen produced the largest weekly change in Commercial net positioning in this week's review, at 49%. That is a significant move, and the short-term message is bearish.
A similarly large change in August followed a sharp rise and was quickly accompanied by renewed weakness. This time, the latest move has again appeared after a dynamic advance, while the iCOT Scores are also showing a meaningful one-year extreme. On that shorter horizon, the major signals are pointing in the same direction: a decline in the yen against the US Dollar looks plausible.
The five-year picture is less straightforward. A bullish COT extreme built earlier and successfully supported the subsequent rise in the yen. Positioning has moved away from those levels, but I do not yet see a bearish long-term extreme comparable with the stronger readings visible further back in the chart.
That creates a useful distinction. I can have a bearish near-term view and still keep a more constructive medium- to longer-term bias. COT signals are not contradictory simply because they point in different directions on different horizons; they may be describing different phases of the same positioning cycle.
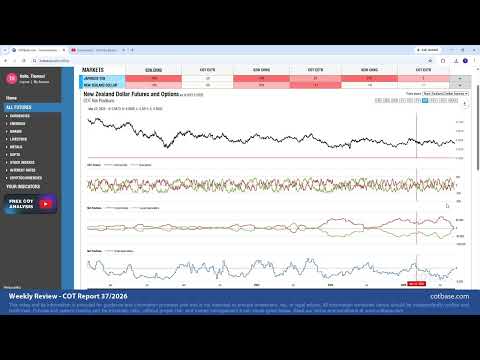
New Zealand Dollar positioning remains mixed rather than decisive
The New Zealand Dollar also showed a larger-than-average weekly Commercial change, at 19%, and that change by itself leans bearish.
I would not put the same weight on it as the yen signal. The iCOT reading is slightly bullish, while the five-year positioning picture is currently more bearish. Taken together, the signals are mixed.
For currency markets, I prefer to cross-check related markets rather than treat one futures contract in isolation. In this case, the Australian Dollar and the Dollar Index can provide useful context before turning a mixed NZD reading into a directional trade idea.
Copper has reached an all-time bearish COT extreme
Copper is one of the most important non-FX signals this week. The market has reached an all-time COT extreme in both Large Speculator and Commercial net positions.
The conventional interpretation is bearish. Historically, extremes of this type have often appeared near periods of significant stress and have sometimes been followed by weaker prices. I therefore regard the current positioning as a warning rather than a reason to chase the rally.
There is an important exception to remember: commercial capitulation. In rare cases, physical-market hedgers can be forced to reduce short hedges as prices rise, and that buying can extend the rally before the positioning signal finally resolves. That is why an all-time extreme is powerful context, but not an exact timing tool.
Soybeans show another all-time bearish extreme
Soybeans are displaying a similar message. Positioning has reached an all-time bearish COT extreme, which makes the market vulnerable to a reversal or a period of weakness.
Again, the signal does not require an immediate response from price. Extreme positioning can remain in place for weeks or even months. The October 2020 episode is a useful reminder that commercial capitulation can temporarily produce the opposite outcome and fuel further gains.
My base case remains cautious. For traders who have already benefited from the long side, this is the type of positioning backdrop that argues for protecting gains rather than assuming the trend must continue indefinitely.
Natural Gas remains bullish, but patience matters
Natural Gas continues to stand out on the bullish side. The current extreme reaches 339 reports in Large Speculator net positions and 342 reports in Commercial net positions.
On a longer historical view, that remains a meaningful bullish setup. Higher prices are plausible, but the timing can be slow. A comparable bullish extreme in 2020 required several months before the market began a much stronger advance.
This is the broader lesson from this week's report. COT data is best used to identify where positioning has become unusually stretched and where pressure is building. It is a map of market structure, not a clock for the exact turning point.
The strongest COT signals often require patience
This week's data offers a particularly clear example of why timeframe and signal type matter. The yen has a strong weekly bearish change signal but a still-relevant longer-term bullish history. Copper and soybeans are at all-time bearish extremes, while Natural Gas remains at a very deep bullish report extreme.
Those signals are useful because they show where positioning risk is concentrated. They become dangerous only when we force them into a single short-term forecast or assume that an extreme must reverse immediately.
For me, the practical conclusion is simple: respect the positioning, separate the time horizons, and allow price to confirm when the market is ready to react.
Watch this week’s full COT review here
This content was partially created by an AI tool.
Author

Thomas Lukacs
COTBase.com
Thomas Lukacs is the founder and CEO of COTbase.com.
















