India: The next China?

Both India and China were once wealthy regions in the pre-industrial age but were impoverished by the penetration of manufactured products in their internal markets in the 19th century which bankrupted their domestic cottage industries and caused the internal linkages in their economies to collapse. Their recoveries in the 20th and 21st centuries therefore depended on the recuperation of domestic production which in turn depended on finding the path to creating modern institutions.
In the 1980’s living standards in India and China were about the same. Since then China has taken off and it’s overall output is now about two and a half times India’s. This is not to say that India has stood still. Reforms in the early 1990’s raised it’s inbuilt default growth rate from 3-4% a year to 6-7% a year. There have been predictions that it could raise it’s long term growth rate to 9% a year, similar to China in it’s high growth decades, but these have never materialised. Nonetheless 7% a year growth represents a doubling of output every decade and with the rate of population growth slowing this implies real improvements in living standards.
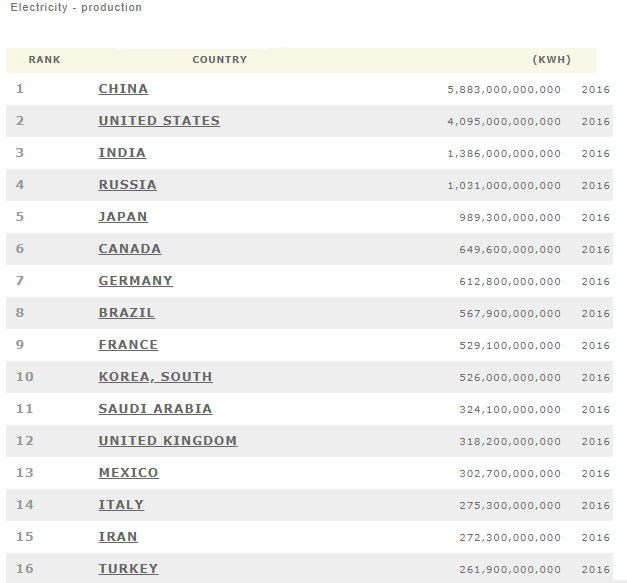
It can be seen on the above table that, though in 2016 China was well ahead, India was the third largest producer of electricity which is a broad based indicator of economic activity. In fact, India produced five times as much electricity as Italy in 2016. Were India to double production again over the following 10 years then by 2026 it would produce 10 times as much electricity as Italy (which has reached a production plateau). India has 20 times as many people as Italy so it could be said to have then reached half of Italy’s level and the same overall output as the European Union as a whole. Also worth mentioning is that, though India’s per capita electricity output in 2016 was quite modest, it’s total production in 2016 would have represented one quarter of total world output in 1970 – that is an indication of how far it has come.
Comparing India with China there are a number of factors:
(i) China created export zones along it’s coast and ensured that it’s exports were internationally competitive and that it’s internal prices were in sync with it’s internationally traded sectors.
India may aspire to repeat this cycle but it is hampered by a number of factors. In clothing, for example, it has vast production capacity but it’s exports have not even kept up with Bangladesh and Vietnam as most output serves the domestic market. This indicates that internal and external prices are out of phase.
(ii) China commands vast infrastructure projects from roads to rail to skyscrapers and the demand thus created stimulates industrial production in the supply chains.
In India the planning process is much slower and land purchase is a major issue for road and rail projects. In the housing sector India builds a little over 6 million units a year of which about 4 million are of modern standard and 2 million are self-builds. China manages about twice this level of housing construction and almost all to modern standards.
(iii) In China in manufacturing they capture the whole production cycle where possible. This would range from the raw materials to the processed materials such as plastics, glass, flat steel etc to the thousands of component parts and also includes the machines and machine tools used in the production process.
The Made in India project aims to repeat the whole production cycle concept but it runs into numerous roadblocks which the Central Government is slow to resolve.
China is a more homogenous society than India with 93% of the population speaking a Han language. India has greater linguistic diversity than Europe and also has greater religious diversity. It’s decision making procedures can be a long term strength if they involve the various groups in the process and give them a stake in the outcome but they ought not to be too slow as to postpone progress.
India’s strength’s include it’s world class IT sector as well as other advanced sectors in engineering, science and technology.
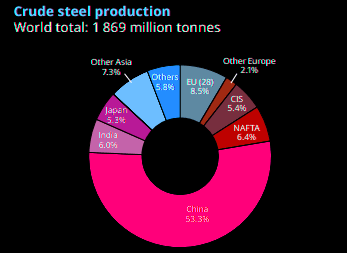
In 2018 India’s steel output was almost as large as the NAFTA area comprising the US, Mexico and Canada with a combined population of 500m.
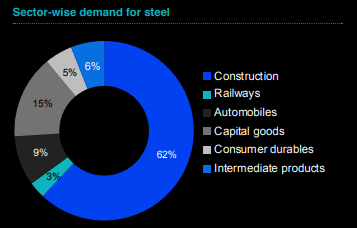
India’s share of world cement production is forecast to double by 2030 and as 62% of all steel output is used in production this indicates a significant increase in steel production.
India’s steel output for 2030 is forecast at 300m tonnes or double that of the EU and 150% of total world steel output in the 1950’s.
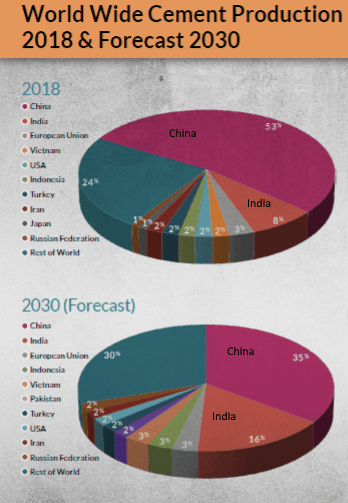
Thus it can be surmised that by 2030 India will be a larger electricity producer than Europe and will also produce twice as much steel and five times as much cement by that time. Thus even though India’s rate of reform is ponderous it continues to progress and a decade from now will have larger economic output than both Europe and the US.
Author

Paul Dixon
Latin Report
Paul Dixon’s focus is economics from a long term perspective.


