How will the new CPI data affect the gold market?

Fresh inflation data is to be released tomorrow. While it may trigger daily fluctuations, the precious metals’ medium- term fundamentals remain bearish.
Stuck in reverse
While risk assets attempted a daily rally on Oct. 11, Bank of England (BOE) Governor Andrew Bailey spoiled the party with his hawkish warning to U.K. pension funds. After restarting QE to curb the rapid rise in U.K. interest rates, he said:
“My message to the funds involved and all the firms is you’ve got three days left now. You’ve got to get this done. The essence of financial stability is that [intervention] is temporary. It’s not prolonged.”
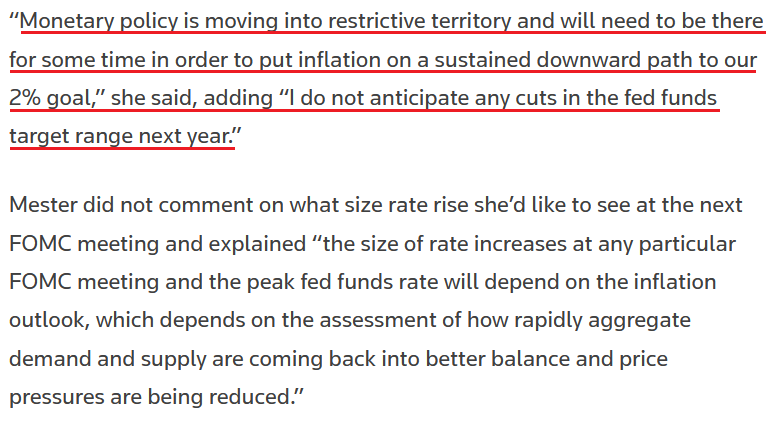
Thus, while gold bucked the trend, it was another down day for silver, mining stocks and the S&P 500. Furthermore, with Fed officials undeterred by the financial market volatility, Cleveland Fed President Loretta Mester said on Oct. 11:
“Unacceptably high and persistent inflation remains the key challenge facing the U.S. economy. Despite some moderation on the demand side of the economy and nascent signs of improvement in supply-side conditions, there has been no progress on inflation.”
She added:
“Given current economic conditions and the outlook, at this point the larger risks come from tightening too little and allowing very high inflation to persist and become embedded in the economy.”
As a result, Mester reiterated that a dovish pivot is out of touch with fundamental reality.
Source: Reuters
Therefore, with central bankers ignoring investors’ cries for help, suddenly, buying the dip isn’t so profitable anymore (you have been warned). However, with the Consumer Price Index (CPI) scheduled for release on Oct. 13, volatility could be amplified depending on the result. As such, while material intraday swings could be the norm for the foreseeable future, the PMs’ medium-term fundamentals remain profoundly bearish. To that point, with Big Tech a major driver of the S&P 500’s performance, rate hikes and quantitative tightening (QT) should weigh on both. Likewise, since the GDXJ ETF is more correlated to the S&P 500’s movement than its precious metals peers, the junior miners are caught in the crossfire.
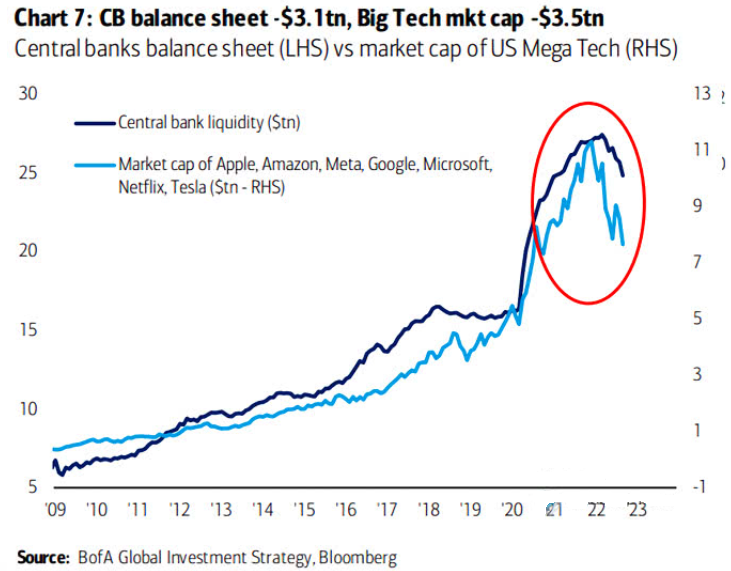
To explain, the dark blue line above tracks central bank liquidity, while the light blue line above tracks the combined market capitalization of Apple, Amazon, Meta Platforms, Alphabet, Microsoft, Netflix, and Tesla. If you analyze the relationship, you can see that quantitative easing (QE) and low interest rates were a boon for Big Tech post-GFC.
However, with the trend reversing, the Fed needs to remove liquidity to quell inflation, and the policy stance should continue to suppress Big Tech’s multiples, while the GDXJ ETF should underperform gold as the drama unfolds.
In addition, while investor sentiment remains highly depressed, the economic impact of the liquidity drain has been relatively minimal outside of the U.S. housing market. Moreover, with the Atlanta Fed projecting resilient real GDP growth in Q3 and demand outweighing supply in the U.S. labor market, the economic climate isn’t as bad as the daily price action suggests.
However, with more rate hikes needed to suppress demand, a sharp rise in bankruptcies could spark the next bout of panic.
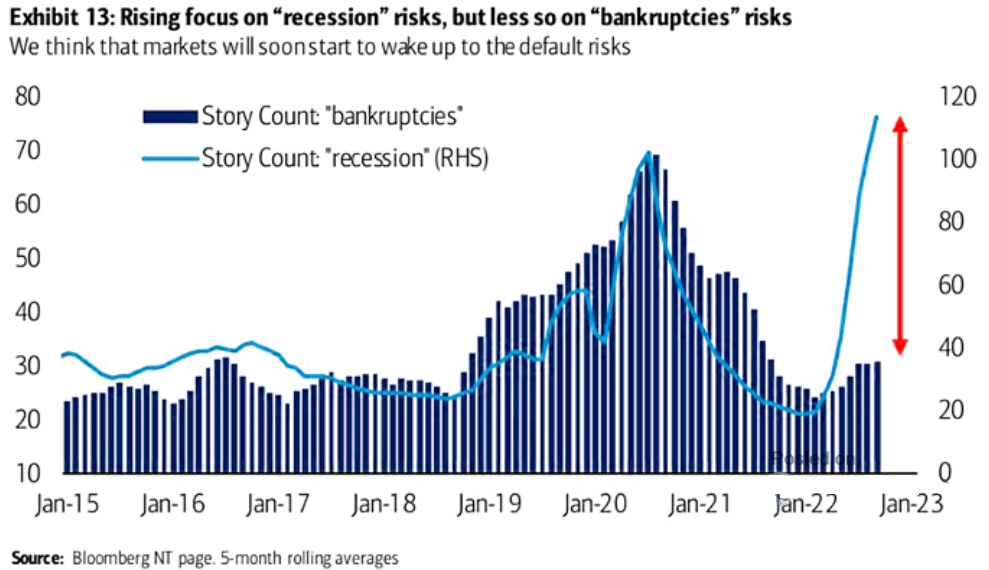
To explain, Bank of America counted recession (the light blue line) and bankruptcy stories (the dark blue bars). If you analyze the relationship, you can see that bankruptcies often move in lockstep with recessionary fears.
However, the right side of the chart shows how bankruptcy stories remain well below recession stories. Yet, that gap should close in the months ahead, as money-losing companies that rely on debt/equity financing to survive could be the next shoe to drop.
For context, I wrote on Oct. 10 that Minneapolis Fed President Neel Kashkari noted the issue on Oct. 6. He said:
“I fully expect that there are going to be some losses and there are going to be some failures around the global economy as we transition to a higher interest rate environment, and that’s the nature of capitalism.
“We need to keep our eyes open for risks that could be destabilizing for the American economy as a whole. But to me, the bar to actually shifting our stance on policy is very high. It should not be up to the Federal Reserve or the American taxpayer to bail people out.”
As a result, with Fed officials warning investors they're on their own until inflation subsides, a cold winter should confront risk assets.
More employment strength
I’ve long warned that a demand-driven U.S. labor market is bullish for Fed policy, and as long as the employment outlook remains constructive, the central bank should make life difficult for gold, silver, mining stocks, and the S&P 500. I added on Oct. 10:
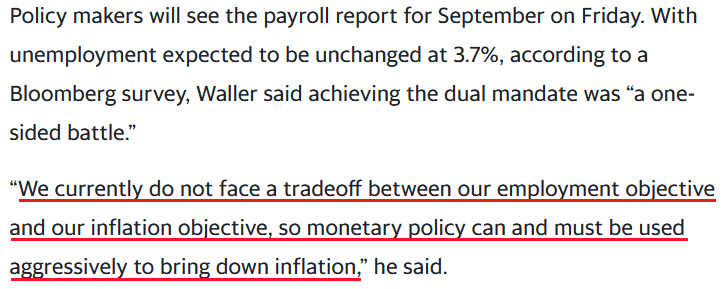
While I stated on Sep. 22 that a resilient U.S. labor market gives the Fed the green light to hammer inflation, Waller made the point for me.
Source: Bloomberg
So with more supportive data hitting the wire recently, the results are bullish for the U.S. federal funds rate (FFR), the U.S. 10-Year real yield and the USD Index.
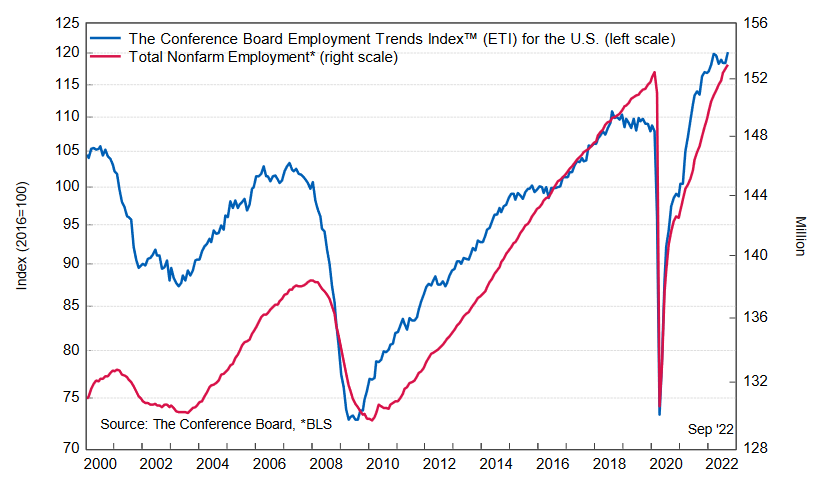
For example, the Conference Board released its Employment Trends Index (ETI) on Oct. 10. The headline index increased from 118.48 in August (a downward revision) to 120.17 in September. Frank Steemers, Senior Economist at The Conference Board, said:
“Some easing to labor shortages is expected as the demand for workers diminishes. However, recruitment and retention difficulties will not disappear as the unemployment rate is only projected to rise to around 4.5% in 2023 and labor supply remains challenged. In this environment, wage growth may also remain elevated. Companies will need to prepare for continued labor shortages and further improve their sourcing and retention strategies to remain competitive.”
Thus, while demand destruction is the perfect ingredient for a dovish pivot, we’re far from that scenario.
On top of that, the NFIB released its Small Business Optimism Index on Oct. 11. The headline index increased from 91.8 in August to 92.1 in September. Moreover, the NFIB’s jobs report (released on Oct. 6) revealed:
“64% reported hiring or trying to hire in September, up one point from August. Eighty-nine percent of those owners hiring or trying to hire reported few or no qualified applicants for their open positions. Twenty-seven percent of owners reported few qualified applicants for their open positions and 30% reported none.”
In addition:
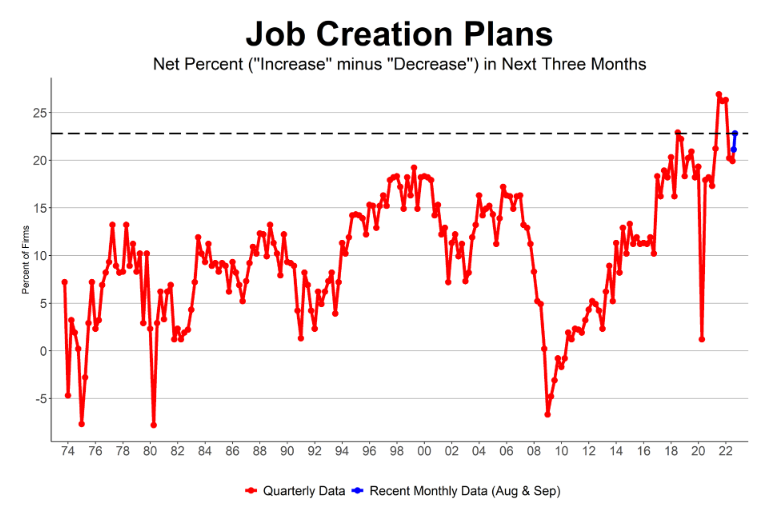
“Small business owners’ plans to fill open positions remain high, with a seasonally adjusted net 23% planning to create new jobs in the next three months, up two points from August.”
Therefore, despite the Fed’s efforts, small business labor demand increased month-over-month (MoM).
Source: NFIB
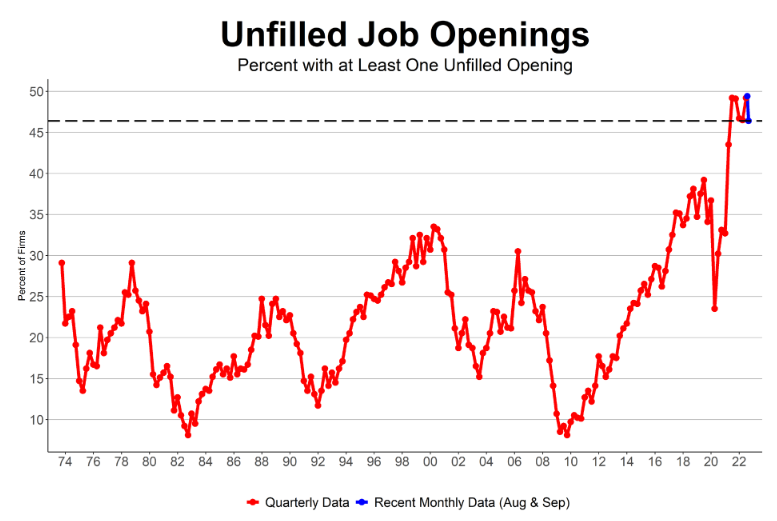
Also noteworthy, the percentage of small businesses with at least one unfilled job opening is closer to its all-time high than its pre-COVID-19 level.
Source: NFIB
Add it all up, and the U.S. labor market remains on solid footing. Likewise, while Wall Street assumes its gloomy mood can influence Fed policy, the reality is that Main Street considers inflation more problematic than decelerating demand.
Source: NFIB
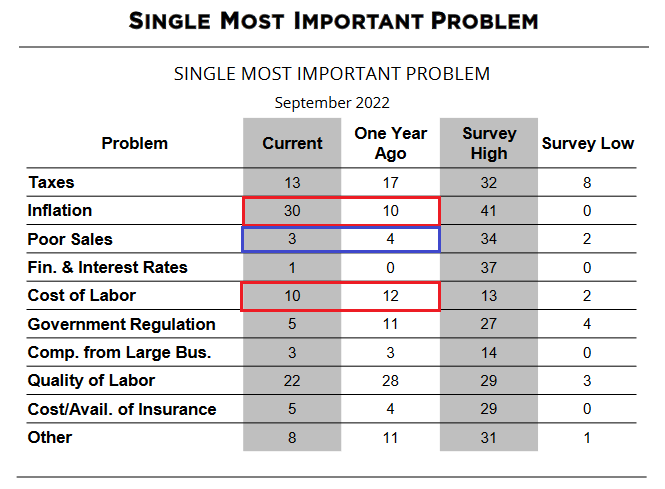
To explain, the red rectangles above show how inflation and the cost of labor are high on the list of small businesses' "single most important problem." In contrast, the percentage of respondents citing poor sales declined from 4% in September 2021 to 3% in September 2022, and the current reading is only 1% above its all-time low.
As such, the Fed still has plenty of room to raise the FFR before the U.S. labor market suffers, and a realization is profoundly bearish for gold, silver, and mining stocks.
The bottom line
With the ‘’good news is bad news’ mantra maiming the bulls, a resilient Main Street is highly bearish for Wall Street. Moreover, with the S&P 500 and the GDXJ ETF selling off mid-day on Oct. 11, anxiety is contagious. So while the CPI release could be a ‘sell the rumor, buy the news’ event, the PMs and the S&P 500’s fundamental issues are far from solved.
In conclusion, the PMs were mixed on Oct. 11, as gold ended the day in the green. Conversely, the U.S. 10-Year real yield ended the day flat, and the USD Index delivered a similar performance. However, the Fed’s inflation fight is bullish for both metrics, and they should hit higher highs in the months ahead.
Want free follow-ups to the above article and details not available to 99%+ investors? Sign up to our free newsletter today!
Want free follow-ups to the above article and details not available to 99%+ investors? Sign up to our free newsletter today!
Author

Przemyslaw Radomski, CFA
Gold Price Forecast
Przemyslaw Radomski, CFA (PR) is a precious metals investor and analyst who takes advantage of the emotionality on the markets, and invites you to do the same. His company, Sunshine Profits, publishes analytical software that any


