If you have been trading for a while you will know by now that market conditions do not always remain the same.

There are times that strong trends exist, very specific themes dominate the news-flow and your trend trading strategy is doing great.

There are other times, where trends do not exist, prices are just rotating up and down without a clear direction and during these times, your mean-reversion strategies are performing much better.

Of course, there are also times, as it is happening now, where markets globally are choppy, volatile, markets tend to be nervous, emotional and volatile and anything seems possible to happen. The markets could easily crush lower, but we wouldn’t be surprised if we had another rally higher!

How can we gain an edge as traders in such an environment?

Is there an approach that could lead to higher probability trades with generous reward to risk outcomes?

Macro Fundamental and intermarket relationships could help you understand better the current economic regime and identify trading patterns with the edge in your favor.

We would not just be too theoretical about this, we will present you insights and trading ideas, we shared with our members, at our FTA FX Desk.

This week that started on the 12th of November, was a tough one, as political themes and newswere dominating the markets, causing uncertainty and confusion to investors.

From the previous week, we had a negative bias towards European equities and specifically the Eurostoxx50, because of Fundamental reasons, political turmoil and we could see in the market profile chart that technically, the price was repeatedly rejected at the Value Area Low of the larger composite profile at 3240, where we have the red horizontal line.

EURJPY

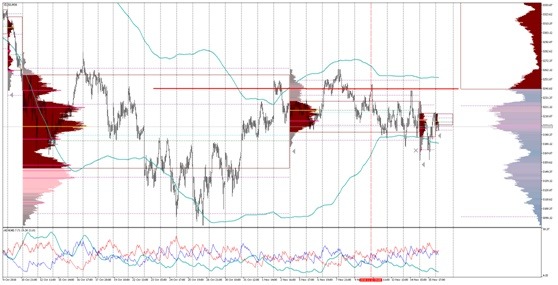
Based on this observation and intermarket relationships, we were looking to sell EURJPY into resistance at the appropriate levels.

EURJPY

The price in EURJPY indeed moved higher and around the 130 level we were sellers, as our PowerFibs algorithm was indicating a significant resistance and we had a strong High Volume Node in that area.

This is just an example of how intermarket relationships between equity indices and currency pairs can be used in your favor.

Another example is the correlation between the CAD and Crude Oil.

EURJPY

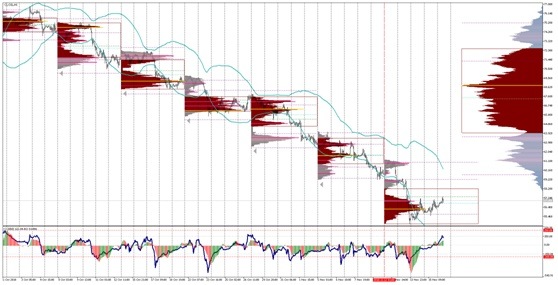
You can see from the chart above that Crude Oil had suffered a strong move lower, but just above the $55 level, we had technically an alert that we were reaching an important support level. We paid closer attention to the structure around this area and we noticed the formation of a High-Volume Node, with a b-shape, right into that area, a sign that perhaps an accumulation process is in place. The sellers were less aggressive and the buyers more interested to do business again in that area.

We didn’t buy Crude.

We were looking to sell the USDCAD.

USDCAD

We noticed in the USDCAD that while Oil seemed to bottom out, USDCAD was topping out!

Please notice the formation of a balance, a ranging area right at the highs of the range.

Because of the potential pause in Oil’s downtrend and other Fundamental reasons, we were looking to sell the USDCAD, if it was going to break the range below 1.3210. If Oil is going to finally enjoy a rebound higher, we will be looking to sell any correction higher up to 1.32. We wouldn’t like to see another break and acceptance above the 1.32 area.

Our other call based on intermarket relationship was between the S&P500 and the USDJPY.

USDCAD

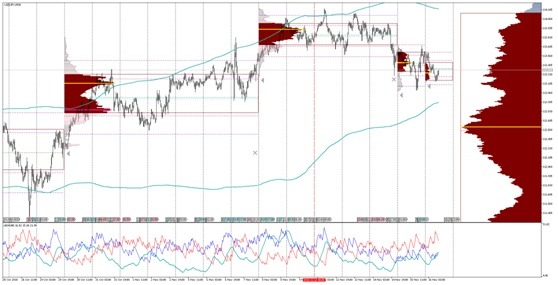
The USDJPY had moved higher but around the 114 level we had the Value Area High of the larger composite profile. That is an important resistance. Price was consolidating for a while and finally we got the break lower. Our bias was only to sell around that area. But why? How could we have a stronger conviction for this trade?

The conviction was because of the relationship between the JPY and equity markets.

Based on the structure of the equity markets, we were sellers in the equities and specifically the S&P500 around the 2816 level, where we have the 1st standard deviation of the VWAP. Price moved back inside the Value Area which was quite negative for us.

USDCAD

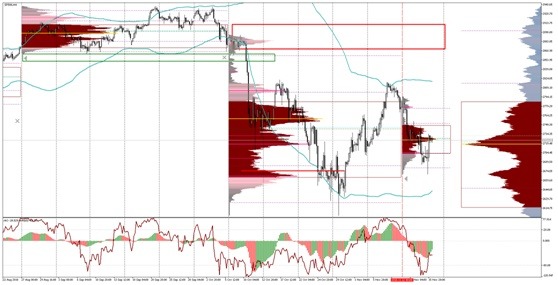
This is why we had a negative outlook not just for equities, but also when the USDJPY reached the 114 level, we had a stronger conviction to be sellers in that area.

Intermarket relationships, understanding better the structure of prices and of course risk management can help you gain a much better trading edge and identify high-probability setups, even at times where market conditions are a bit volatile and not optimal.

None of the fotis trading academy nor its owners (expressly including but not limited to Marc Walton), officers, directors, employees, subsidiaries, affiliates, licensors, service providers, content providers and agents (all collectively hereinafter referred to as the “fotis trading academy ”) are financial advisers and nothing contained herein is intended to be or to be construed as financial advice

Fotis trading academy is not an investment advisory service, is not an investment adviser, and does not provide personalized financial advice or act as a financial advisor.

The fotis trading academy exists for educational purposes only, and the materials and information contained herein are for general informational purposes only. None of the information provided in the website is intended as investment, tax, accounting or legal advice, as an offer or solicitation of an offer to buy or sell, or as an endorsement, recommendation or sponsorship of any company, security, or fund. The information on the website should not be relied upon for purposes of transacting securities or other investments.

You hereby understand and agree that fotis trading academy, does not offer or provide tax, legal or investment advice and that you are responsible for consulting tax, legal, or financial professionals before acting on any information provided herein. “This report is not intended as a promotion of any particular products or investments and neither the fotis trading academy group nor any of its officers, directors, employees or representatives, in any way recommends or endorses any company, product, investment or opportunity which may be discussed herein.

The education and information presented hereinen is intended for a general audience and does not purport to be, nor should it be construed as, specific advice tailored to any individual. You are encouraged to discuss any opportunities with your attorney, accountant, financial professional or other advisor.

Your use of the information contained herein is at your own risk. The content is provided ‘as is’ and without warranties of any kind, either expressed or implied. The fotis trading academy disclaims all warranties, including, but not limited to, any implied warranties of merchantability, fitness for a particular purpose, title, or non-infringement. The fotis trading academy does not promise or guarantee any income or particular result from your use of the information contained herein. The fotistrainingacademy.com assumes no liability or responsibility for errors or omissions in the information contained herein.

Under no circumstances will the fotis trading academy be liable for any loss or damage caused by your reliance on the information contained herein. It is your responsibility to evaluate the accuracy, completeness or usefulness of any information, opinion, advice or other content contained herein. Please seek the advice of professionals, as appropriate, regarding the evaluation of any specific information, opinion, advice or other content.

Marc Walton, a spokesperson of the fotis trading academy, communicates content and editorials on this site. Statements regarding his, or other contributors’ “commitment” to share their personal investing strategies should not be construed or interpreted to require the disclosure of investments and strategies that are personal in nature, part of their estate or tax planning or immaterial to the scope and nature of the fotis trading academy philosophy.

All reasonable care has been taken that information published on the Fotis trading academy website is correct at the time of publishing. However, the Fotis trading academy does not guarantee the accuracy of the information published on its website nor can it be held responsible for any errors or omissions.

Recommended Content


Recommended Content

Editors’ Picks

AUD/USD remained bid above 0.6500

AUD/USD remained bid above 0.6500

AUD/USD extended further its bullish performance, advancing for the fourth session in a row on Thursday, although a sustainable breakout of the key 200-day SMA at 0.6526 still remain elusive.

AUD/USD News

EUR/USD faces a minor resistance near at 1.0750

EUR/USD faces a minor resistance near at 1.0750

EUR/USD quickly left behind Wednesday’s small downtick and resumed its uptrend north of 1.0700 the figure, always on the back of the persistent sell-off in the US Dollar ahead of key PCE data on Friday.

EUR/USD News

Gold holds around $2,330 after dismal US data

Gold holds around $2,330 after dismal US data

Gold fell below $2,320 in the early American session as US yields shot higher after the data showed a significant increase in the US GDP price deflator in Q1. With safe-haven flows dominating the markets, however, XAU/USD reversed its direction and rose above $2,340.

Gold News

Bitcoin price continues to get rejected from $65K resistance as SEC delays decision on spot BTC ETF options

Bitcoin price continues to get rejected from $65K resistance as SEC delays decision on spot BTC ETF options

Bitcoin (BTC) price has markets in disarray, provoking a broader market crash as it slumped to the $62,000 range on Thursday. Meanwhile, reverberations from spot BTC exchange-traded funds (ETFs) continue to influence the market.

Read more

US economy: slower growth with stronger inflation

US economy: slower growth with stronger inflation

The dollar strengthened, and stocks fell after statistical data from the US. The focus was on the preliminary estimate of GDP for the first quarter. Annualised quarterly growth came in at just 1.6%, down from the 2.5% and 3.4% previously forecast.

Read more

Majors

Cryptocurrencies

Signatures