Gold’s weekly update: Gold bulls lead the precious metal to new record highs

The price of gold continued its rally since our last report, reaching new All Time High levels. On a fundamental level we are to have a look at fundamental issues affecting gold’s direction, including the validity of the negative correlation of the USD with gold’s price, the ongoing US Government shutdown and the Fed’s stance in order to make some sense of this rally. On a technical level we are to provide an analysis of gold’s daily chart at the end of report for a rounder view.
US Government shutdown maintains uncertainty for the markets
The dominant fundamental issue in the US currently is the Government shutdown which continues to feed uncertainty the markets. We had mentioned the issue in our last report and the issue is still ongoing, with both sides, the Democrats in Congress and Trump’s Government seem to be digging into the issue. On the one hand the Democrats do not seem to be backing down from the demands for health subsidies in order for funding to flow towards the US Government, while on the other hand US President Trump seems determined to impose his will, yet we have to note that the White House seems to have eased on its threats that thousands of Federal workers are to be permanently fired. Also we note that the release US economic data is being delayed enhancing further the uncertainty in the markets. We view the issue as feeding gold bulls providing safe haven inflows for the precious metal. On the flip side any signs pointing towards a resolution of the political impasse could ease support for gold.
The struggle within the Fed
We also note the Fed’s stance as a potential factor affecting gold’s direction. The market’s expectations for the time being are clearly on the dovish side as Fed Fund Futures currently imply that the market prices in a rate cut in the October meeting and another one in the December meeting. The US Government shutdown tends to increase the pressure on the bank to ease its monetary policy as on the one hand the delay in the release of the US employment report for September with its NFP figure tends to obscure the current situation of the US employment market. Also certain areas in the US like Washington DC may be threatened with a shrinking economy by the US Government shutdown also intensifying the pressure on the Fed to ease its monetary policy. Also we note that some Fed policymakers are actively pushing for a faster and wider easing of the bank’s monetary policy like Stephen Miran. On the contrary some Fed policymakers seem to hesitate. It’s characteristic that Kansas Fed President Schmid was reported by Reuters signaling that he is disinclined to cut interest rates further, and favoring the Fed focusing on the danger of too-high inflation in contrast to the obvious employment market weakness. Overall there seems to be a power struggle within the Fed between the doves and hawks. We highlight the release of the Fed’s September meeting minutes on Wednesday and should the document reaffirm or even enhance the market’s expectations for the bank to ease its monetary policy further we may see gold’s price getting some support, on the flip side should the market be forced to ease its dovish expectations we may see the release weighing on gold’s price. Also on Thursday the bank is to release Fed Chairman Powell’s pre-recorded welcome remarks before the Community Bank Conference. We see the case for the Fed Chairman to maintain doubts ion regards to the necessity of extensive easing of the bank’s monetary policy and should such doubts be reflected in his comment we may see Gold’s price moving southwards.
Gold’s negative correlation with the USD inactive
Lastly we are to examine whether the negative correlation of gold with the USD is active or not. Looking at the chart of the USD Index we note a strengthening of the greenback against its counterparts on Monday and during today’s Asian and European sessions. Similarly Gold’s price was rallying yesterday and today hence we tend to view the negative correlation of the two trading instruments as being inactive. Furthermore, we note that the rise of US bond yields since last Thursday seems to leave gold traders unimpressed, which allows for the conclusion of a current inactivity of the negative correlation of US Bond yields with gold, given that US Bonds are traditionally being considered an antagonistic safe haven destination for investors.
Technical analysis
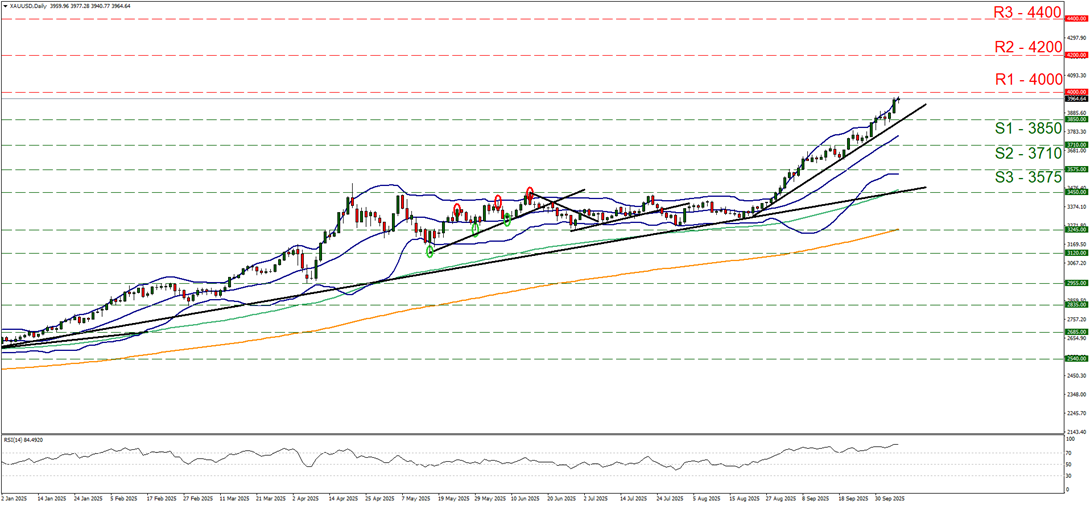
XAU/USD daily chart
-
Support: 3850 (S1), 3710 (S2), 3575 (S3).
-
Resistance: 4000 (R1), 4200 (R2), 4400 (R3).
On a technical level, we note that gold’s price continued to rally since our last report breaking the 3850 (S1) resistance line now turned to support and is currently aiming for the 4000 (R1) resistance level. We intend to maintain our bullish outlook as long as the upward trendline guiding gold’s price since the 22nd of August remains intact. The RSI indicator remains well above the reading of 70, implying a strong bullish market sentiment for gold, yet at the same time reminding traders that gold is at overbought levels since the start of September and is ripe for a correction lower. Similar signals are being sent by the price action reaching the upper Bollinger band. Should the bulls continue leading gold’s price, we may see it breaking the 4000 (R1) line and start aiming for the 4200 (R2) level. Should the bears take over, we may see gold’s price breaking the 3850 (S1) support line, continuing lower to break the prementioned upward trendline in a first signal of an interruption of the upward movement and continuing to breach also the 3710 (S2) support level, with the next possible target for the bears being set at the 3575 (S3) support barrier.
Author

Peter Iosif, ACA, MBA
IronFX
Mr. Iosif joined IronFX in 2017 as part of the sales force. His high level of competence and expertise enabled him to climb up the company ladder quickly and move to the IronFX Strategy team as a Research Analyst. Mr.


